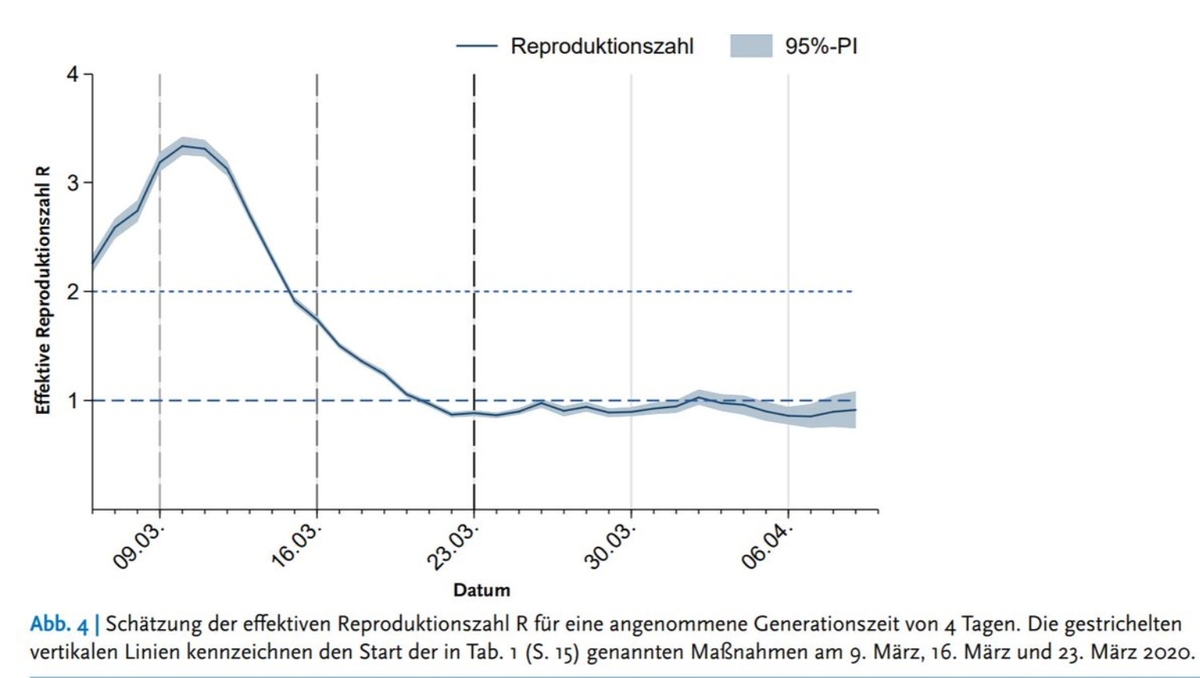
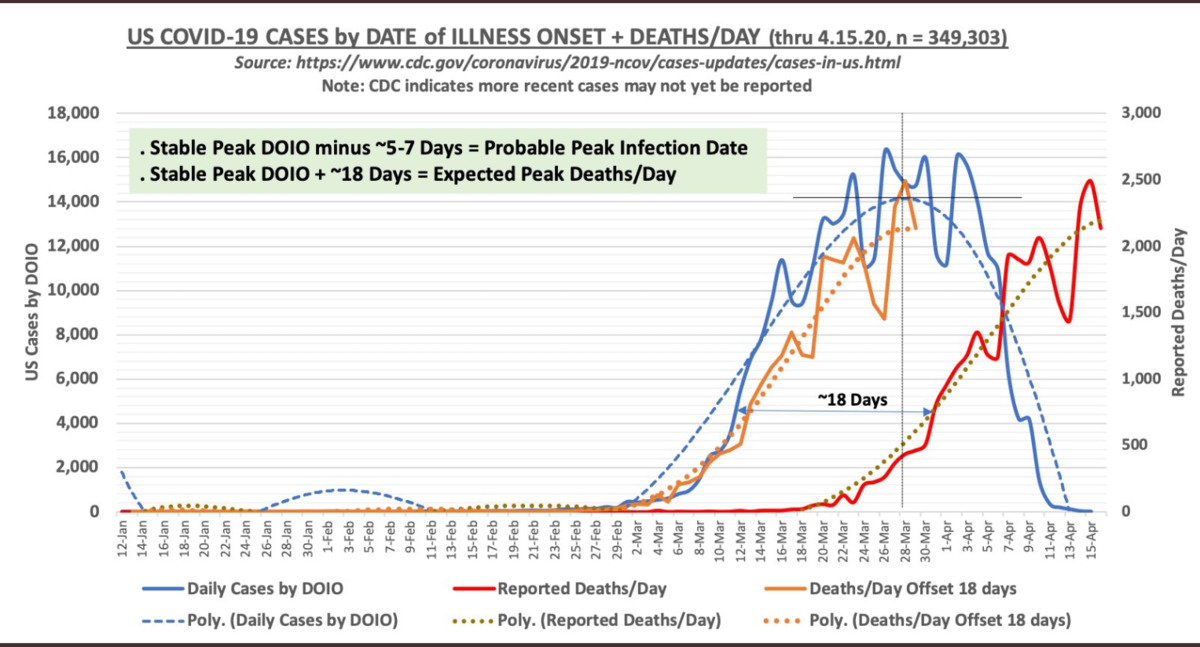


 Tests done across 40 locations/19 counties. Growing and unmistakeable -- ColoVT82 04/23/2020 4:10PM Tests done across 40 locations/19 counties. Growing and unmistakeable -- ColoVT82 04/23/2020 4:10PM What we are quickly finding is that there are millions more that have had -- fordham 04/23/2020 3:06PM 50k people have died -- VTSnake 04/23/2020 4:14PM The very large percentage of people that have died had multiple health -- fordham 04/24/2020 10:26AM More people will die from alcohol induced liver disease and lung cancer -- GreenvilleVT 04/23/2020 4:17PM Once again, both of those are known ailments. Corona so far is sitll -- vt_mughal 04/23/2020 5:18PM I didn’t know those were contagious. -- Femoyer Hokie 04/23/2020 4:22PM I have said all along Mother Nature is undefeated. This should -- VTMONEY94 04/23/2020 5:40PM What is happening to the economy is not a function of someone’s decision. -- Femoyer Hokie 04/23/2020 6:35PM For thousands of years there have been many plagues, all -- VTMONEY94 04/23/2020 6:50PM Societies are destabilized. Good news, no pogroms now like 1300s Europe ** -- Flemington Hokie 04/25/2020 09:43AM Gone as planned? Dude what's wrong with you?? ** -- VTSnake 04/24/2020 07:05AM Great post. ** -- hokie77th 04/23/2020 7:46PM Absolutely and totally disagree, and you only have the ability to say what -- vt_mughal 04/23/2020 4:01PM How do you know it would be much worse -- hokie77th 04/23/2020 7:47PM Pls consider these 2 charts. Both curves peaked b4 implementation of lock -- ColoVT82 04/23/2020 4:26PM It's not like the only choices here are "catastrophic" or "no big deal." -- Tafkam Hokie 04/23/2020 3:39PM Wha?! -- vthokieq 04/23/2020 4:07PM Whoops. My mistake. -- Tafkam Hokie 04/23/2020 4:10PM Now we're talking! -- vthokieq 04/23/2020 4:20PM Wait, you're agreeing with me? -- Tafkam Hokie 04/23/2020 4:22PM I agree with that, the issue we have now is getting the restrictions lifted -- fordham 04/23/2020 3:56PM It feels to me like elected officials are being weenies about making a -- Tafkam Hokie 04/23/2020 4:08PM Totally agree. ** -- GobblerCE 04/23/2020 3:53PM Uhhh, show us your math please. Here's mine: -- 81_Hokie 04/23/2020 3:20PM Here is my math because a few things you are not considering -- HokieZig 04/24/2020 10:39AM Nys health department published the 21% figure for NYC -- GreenvilleVT 04/23/2020 3:23PM Was asking Fordham how he arrived at COVID = flu ** -- 81_Hokie 04/23/2020 3:32PM COVID-19 killed more people in a few months than the flu did in a year. -- RhinoVT 04/23/2020 3:12PM The article you linked contradicts your message title claim.... -- HokieJay 04/23/2020 3:55PM See below for another article w/ same title. BTW, 12K < 46785 and climbing -- RhinoVT 04/23/2020 4:00PM 61K in 2018. 12K in 2011 isn't likely to happen again . -- HokieJay 04/23/2020 4:18PM Flu season is not the entire year.....maybe 6 months in the colder climates -- statmanfromHCyrs 04/23/2020 3:42PM 2 years ago the normal flu killed around 80,000 -- fordham 04/23/2020 3:17PM We also don't have definitive proof of all Coronavirus deaths because -- hoosnowahokie 04/23/2020 3:24PM We also have people that are elderly we very serious issues being catorgize -- fordham 04/23/2020 3:29PM This is not people on death's door that would have died -- 81_Hokie 04/23/2020 3:41PM You don't think social distancing reduced the COVID number? -- 48zip 04/23/2020 3:20PM Yes it did, but again you can warn those at risk to protect themselves and -- fordham 04/23/2020 3:23PM 1. We mitigated. and 2, the were predictions. BTW, I didn't suggest -- 48zip 04/23/2020 3:34PM And from the National Review (link) -- RhinoVT 04/23/2020 3:18PM Yes, for elderly and smokers it has been hell -- fordham 04/23/2020 3:21PM I thought your point was this was similar to the flu? ** -- RhinoVT 04/23/2020 3:23PM Every year elderly people succomb to the flu, a few years -- fordham 04/23/2020 3:24PM The flu never overwhelmed national healthcare systems like this one has. ** -- TJ Hokie 04/23/2020 3:09PM Hospitals are running at 30% occupancy in most of the country right now. ** -- HokieJay 04/23/2020 4:22PM NYC and some in the NE were strained. The rest of the country has no s -- fordham 04/23/2020 3:18PM No strain on other hospital system...yet. it is still *very* early. ** -- TJ Hokie 04/23/2020 3:24PM I will take the under. Lower case reports almost every day. -- GreenvilleVT 04/23/2020 3:27PM THe rest of the country changed their lifestyle. ** -- 48zip 04/23/2020 3:21PM No, the gov. forced businesses to close ** -- fordham 04/23/2020 3:27PM You both just said the same thing -- Beerman 04/23/2020 3:53PM Name a hospital in America that has hit its capacity this month? -- GreenvilleVT 04/23/2020 3:12PM Elmhurst ** -- Flemington Hokie 04/25/2020 09:45AM Never hit capacity. -- GreenvilleVT 04/25/2020 10:35PM Search ICU full and you'll find many ** -- lchoro 04/23/2020 4:32PM Due in part to the effrots by all Americans, plus the fear of going to a -- 48zip 04/23/2020 3:18PM I fear you will see cancer and other diagnosis -- GreenvilleVT 04/23/2020 3:31PM Good point. -- HokieJay 04/23/2020 4:24PM Yep. That's already being predicted. ** -- 48zip 04/23/2020 3:36PM ^^ This ** -- TJ Hokie 04/23/2020 3:25PM And they never distanced like we're doing now. That rarely get's mentioned -- 48zip 04/23/2020 3:11PM
Tech Sideline is Presented By:

Our Sponsors