

![]()
This year’s big winner among Power 5 conferences in money earned from the NCAA Tournament is the ACC. The conference will make about $35 million in the next six years for their performance in this year’s tournament.
The NCAA distributes money to conferences based on how their teams perform in the NCAA Tournament over a six-year rolling period. In any given year, the NCAA pays a conference an amount of money known as an “NCAA Tournament Unit” for each game the teams from a conference play in the tournament in the most recent six years. (Championship games are excluded.)
This year, the value of an NCAA Tournament unit is $260,525, per this Forbes article by Chris Smith. So, for example, if ACC teams have played a total of 89 games in the last six NCAA tournaments (a made-up number, so no criticism in the comments field, please), the conference will receive a check for 89 x $260,525, or about $23.2 million.
This year, teams from the ACC played in a total of 21 tournament-unit eligible games. For the next six years, the NCAA will pay the ACC 21 times the value of a tournament unit, for their performance in the 2015 tournament.
The value this year is $260k, but that value goes up every year. According to Chris Smith’s article linked above, a single tournament game played will be worth a total of $1.65 million to the ACC over the next six years.
Multiply that $1.65 million times 21, and you get that the ACC will be paid about $34.7 million over the next six years for their 2015 tournament units. That’s $5.78 million per year for the conference, or an average of $385,000 per year for each of the conference’s 15 schools over the next six years. Multiply $385k by six, and you get a total value per school of $2.31 million over six years.
Here are the number of NCAA Tournament units earned (number of tournament games played, excluding the championship game) by each of the Power 5 conferences (and the Big East, since they received six bids) this year, and the estimated total value over the next six years of those units. The total value is then divided by the number of teams in the conference, which gives the total value per team over the next six years.
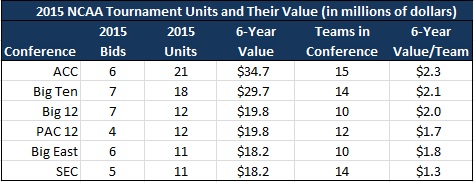
The only conference to come close to the ACC in total dollars was the Big Ten, which of course sent two teams to the Final Four (Michigan State and Wisconsin). And even after you factor in the number of teams in each conference, the per-school take by the ACC exceeds every other conference.
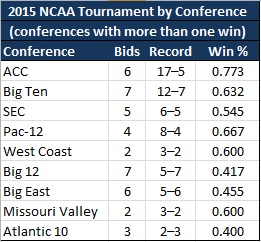
What about performance on the court? Follow the money: the ACC didn’t have the most teams in the tournament, but it had the most wins (by far) and the best record (table copied from Wikipedia).
Teams in the ACC have now won four of the last seven NCAA Tournaments.
- 2009: North Carolina
- 2010: Duke
- 2013: Louisville (members of the Big East at the time)
- 2015: Duke
ACC teams will, of course, be strong contenders again in 2016. ESPN bracketologist Joe Lunardi has released his first bracket for 2016, and it features seven ACC teams, including two #1 seeds: Virginia and North Carolina. Other ACC teams Lunardi projects to make the tournament are Duke (2 seed), Notre Dame (5), Louisville (5), NC State (6), and Miami (7).
Comments, criticisms, and corrections are welcome, in the comments section below.
 Print
Print


Does each year then cause overlaps and additional payments? For example, the 2014 tournament will have produced money for a 6 year period.. So there will be payments from the 2013, 2014, 2015…tournaments next year?
Yes. This year’s payment (2015) includes payments for units from the 2009-2014 tournaments.
Next year will be payments for units from the 2010-2015 tournaments. Etc.
Someone needs to ask why the Big 12 and the Big East got seven and six bids each? Pitiful performances.
And the icing on the cake is the money Maryland paid to leave. Not a bad earnings stream to top off our co natl chamojo ship in football.
Here is another good link Will. I had it in a post yesterday. It shows more of the 6-year tabulation process by conference, and the video within is hokey but helpful. One of the more interesting stats from your article is the gap of only 3 units from the ACC to the Big 10 this year. The Big 10 has a huge lead on the ACC in terms of the 6-year running total. They have 96 compared to the ACC’s 69. Or a $24.9 million payout vs. a $17.9. So it will take quite a few years of better ACC play and lesser Big 10 play for the ACC to close this gap. Thanks for the article.
http://www.bloomberg.com/graphics/2015-march-madness-basketball-fund/
That is one seriously slick set of graphs in that article.
So, essentially, the tournament teams are paying Buzz’s salary. Thanks!
Thanks, I was curious. Can’t believe how confusing the NCAA makes it.
Any chance this helps the ACC get a seventh bid next year?
Well, the last sentence of the article says Lunardi picks 7 ACC teams to make it so I would say there is a pretty good chance.
So it seems each ACC team is getting $2m to $2.5m per year from NCAA tourney windfall. How does this compare to football bowl revenue per team in the ACC. FB >> BB.
The article says SIX year value per team is $2.3 million, or $385,000 each year for 6 years. Considering also that the lion share of a Bowl game’s money goes to the actual team that plays in it, football revenue is greater by far.
The ACC pays out bowl money evenly (with some allowance for expenses). It was the Big East that used to pay the teams that went to the bowls a bigger share … “real” conferences don’t do it that way.
I know it is $2.3 over SIX years, but we are getting the LAST 5 years or rolling NCAA BB windfall; thus the range of $2m – $2.5m per year which would be the aggregate ACC windfall.