
 Text by Will Stewart, infographics by OXVT (follow him on Twitter here, and view all previous infographics updates on TSL here). Click all infographics for a larger version!
In this week’s infographics series, we’ll take a look at Tech’s 2014 All-Americans and review some of VT’s record performances in bowls by offensive skill players.
Plus, have you ever wondered how Dadi Nicolas and Ken Ekanem compare to some of the great DE combos in Tech history? They’re closer than you might think.
As always, click all infographics for a larger version.
Dadi and Ekanem: Pretty good sackmasters
Let’s begin with a look at how this week’s defensive ends, Ken Ekanem (8.5 sacks) and Dadi Nicolas (9 sacks) compare to some of the great VT sack duos of the past.

Turns out they make a pretty good pair of sacking defensive ends.
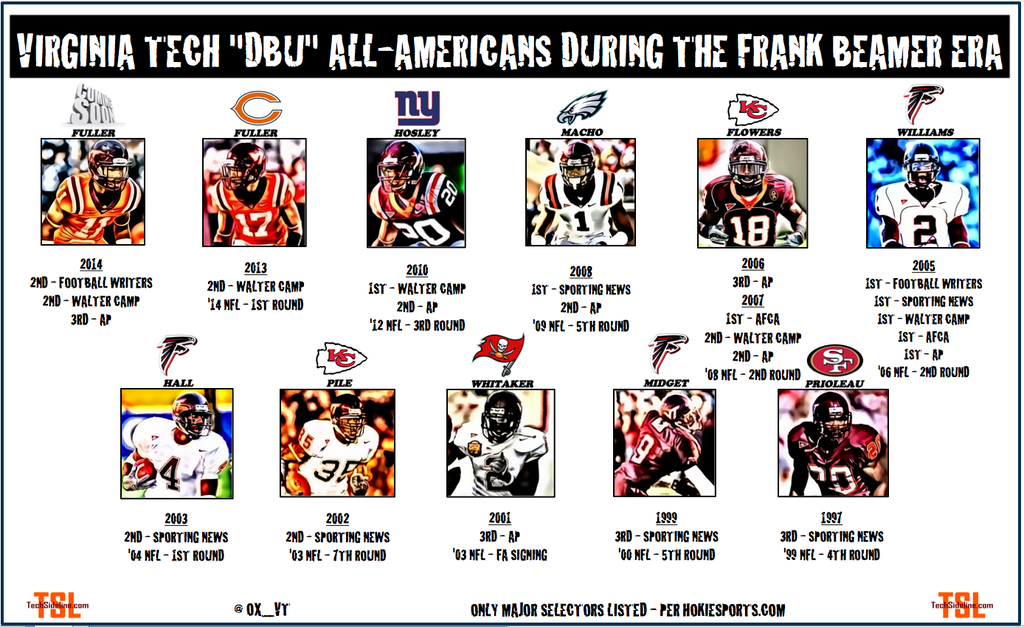
VT’s All-Americans
This season, two Hokies earned All-American honors: Kendall Fuller (Football Writers, Walter Camp, and AP) and Bucky Hodges (Freshman AA, USA Today). They’re in great company.
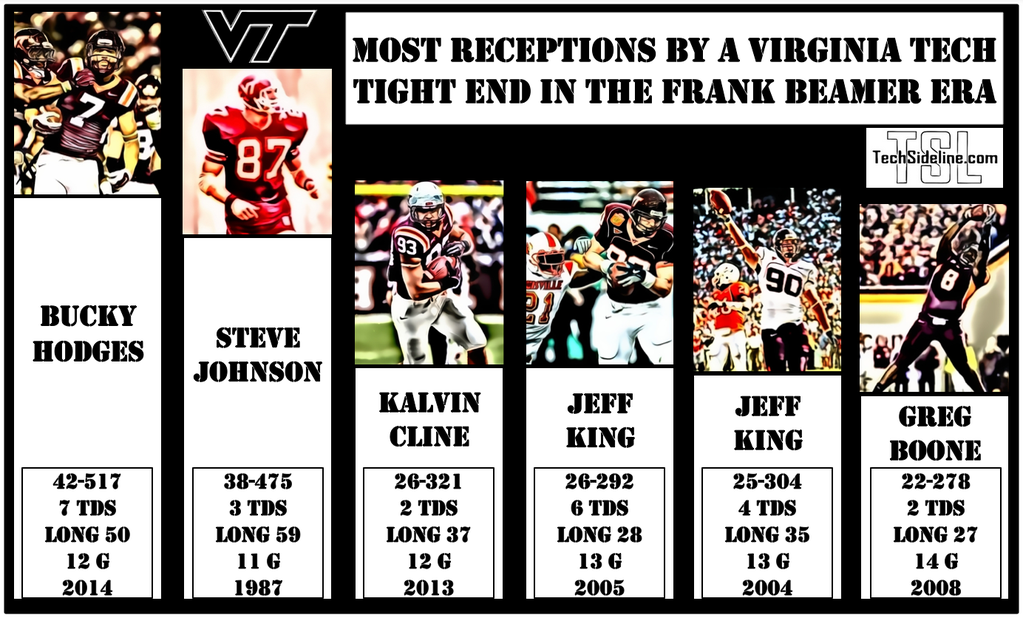
Historic bowl performances by Hokie offensive skill players
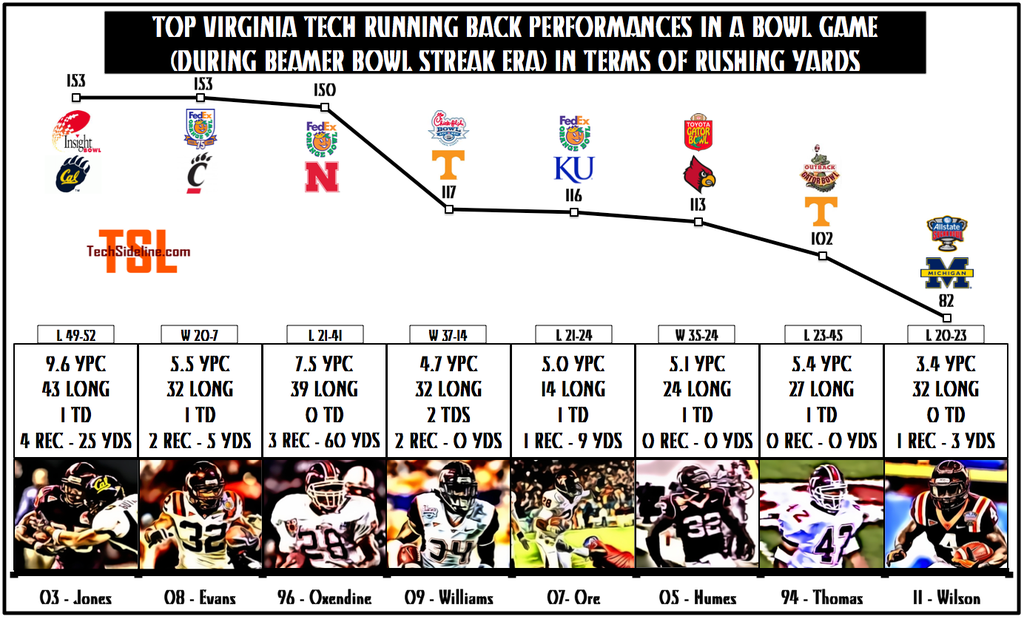
Ya know … Cincinnati’s defense isn’t very good. If you’re wondering what it would take to put up a historic performance against them at the QB, WR, or RB position, here’s a look at some of VT’s more impressive bowl performances at those positions. This is really interesting stuff.
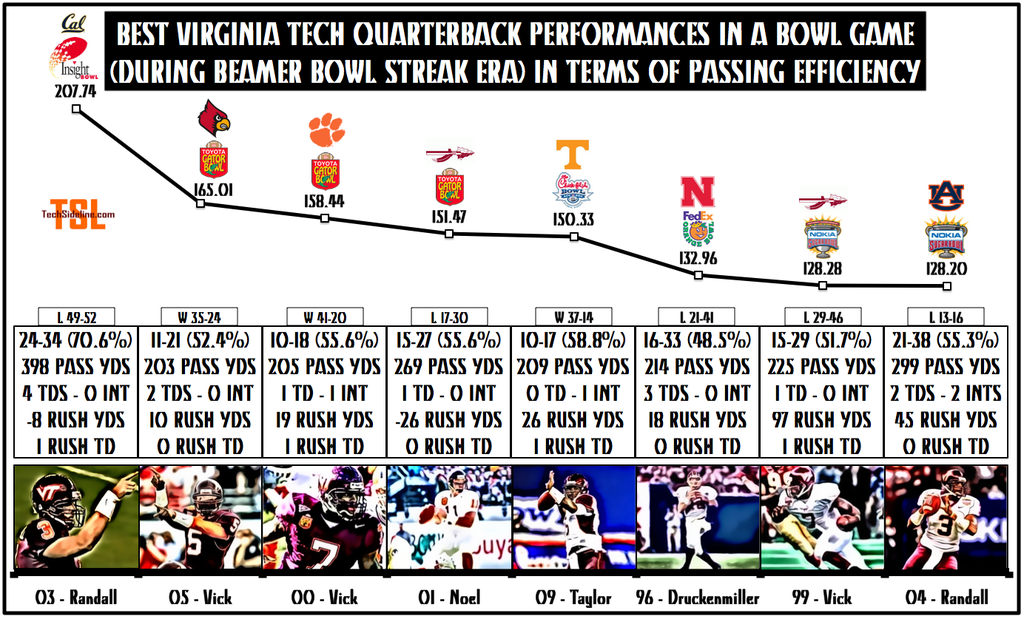
Bet you never expected to see Grant Noel fourth on that list, did you?
Too many great efforts in losing games on that list. Blech.

Now you know why Grant Noel had such a good game in the 2001 Gator Bowl. He had AD to throw to. (Do you remember that was Bryan Stinespring’s first game as offensive coordinator?)
Many thanks to OXVT for the great infographics all season long! Follow him on Twitter, where he recently went over the (angels singing) 1,000-follower threshold.
 Print
Print


All those great performances in big bowl games, yet a “L” in most of them. Usually a special teams blunder or some other head scratcher the culprit.
I like the * next to the 0 TD for Coale in 2011. Everyone but the replay official knows he had 1 TD.
Agree….Danny had 9 catches.
David Wilson should have been over 100 against Michigan, were it not for 25 yards the wrong way. More to the point, he shouldn’t have been in the backfield near the goal line.
Thanks man, I thought I had forgotten that play until you brought it back up from the recesses of my memory. Lol. Wilson always did have a habit of starting out going the wrong direction….maddening to watch.
There are WAYYYY too many losses on those charts, especially considering they are showing the BEST EVER metrics for key offensive performance. Generally 3 wins out of 8 in that data set…not good.
Meh…a few of those losses look on paper to be because we did not play defense. MNC we gave up 46 on some very big plays. NE we gave up 41 pts after scoring on the first drive. Our D didn’t even take the field when Cal had the ball (ITRC correctly Hall was playing then too) and they scored 52 pts. We gave up 45 pts to Tenn led by Peyton Manning…and they could have scored more. Stan with Luck dissected our defense and scored an easy 40 looking away.
And we actually won the Michigan game.
Bowls games are designed to be 50/50 games…so I don’t see 3 out of 8 as TERRIBLE, not great, but not as bad as some make it out to be.
But the crux of my point is that all revisionists like to place 100% of the blame on the Offense, when in fact, there are games that the Offense performed fine, but we could not keep points off the board. I remember a season where our Offense was scoring an average of approximately 30 pts or more per game under Stinespring. For example, go back to the years 2004-2007 and look at some of the scores (NOTE: Yes some were ST and D scores, but most were Offense). If we could score that many points today, everyone would be happy.
A large percentage of the top performances were in bowl losses (QB – 5/8, RB – 5/8, WR – 6/8). The way they are constructed and the strategy VT employs on offense just isn’t built to win shootouts (I know, thanks Capt. Obvious but I thought it was interesting to see the records paint a clear picture).
Truth hurts. Somebody has to score to win the game and you never know how much you need to score to win the game until after the game is over. Score early, score often.
This!