
 Text by Will Stewart, infographics by OXVT (follow him on Twitter here, and view all previous infographics updates on TSL here). Click all infographics for a larger version!
In the final part of this week’s infographics series, we will go over some team stats, and show you where this team’s performance fits in historically.
As always, click all infographics for a larger version.
Record according to kickoff time
You hear it all the time. Statements like, “The Hokies lose a lot of big night games!” or “The Hokies lose too many noon games, because the players aren’t ready and the fans aren’t fired up!”
Probably one of the more useful charts OX has produced this year is this one. It provides information for all debates about kickoff time.

Remember, it’s for home games only.
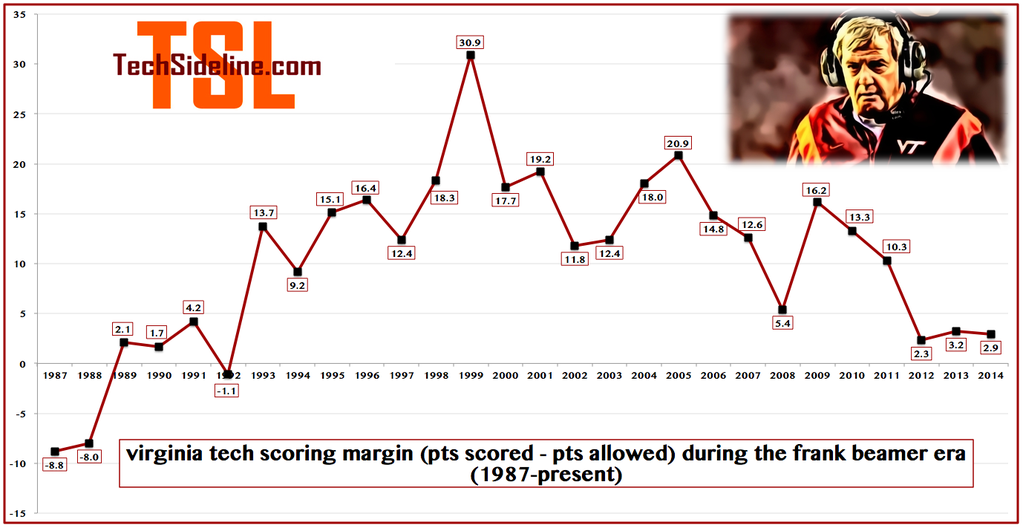
Two important margins get too close for comfort
With the Hokies hovering just above .500 in the last three seasons (21-17, with a bowl game remaining), it’s not a surprise that two important margins — rushing yardage margin and scoring margin — have shrunk significantly.
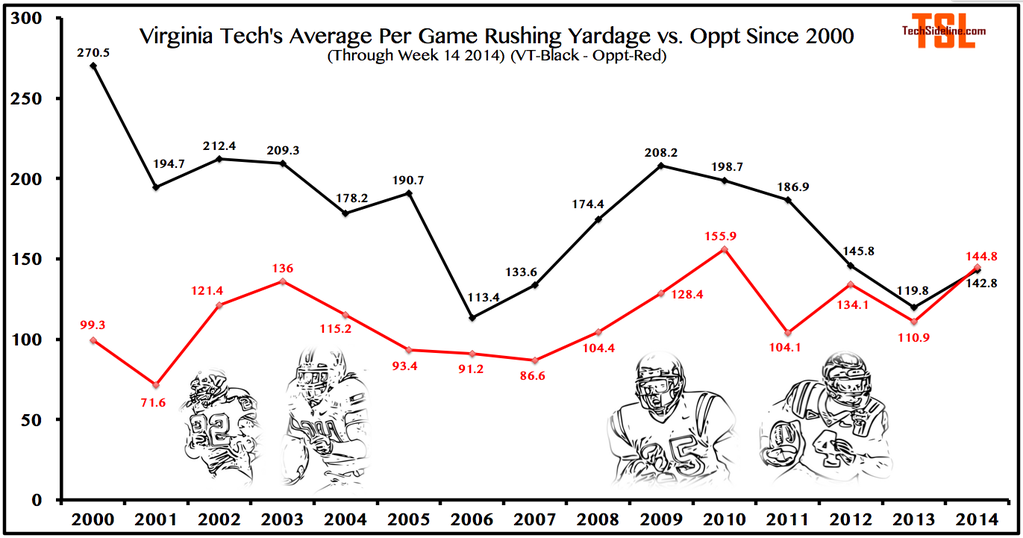
As you can see, if the Hokies don’t outrush Cincinnati in the bowl game, it will be the first time in a long time the Hokies have been outrushed by their opponents.
And for the third year in a row, they’re barely outscoring their opponents, something the Hokies have previously done comfortably in the Beamer Bowl era.
More margins
The Hokies — in terms of total yards — haven’t outgained their opponents by very much this season, and are on course to have the second-lowest yardage margin since 2000.
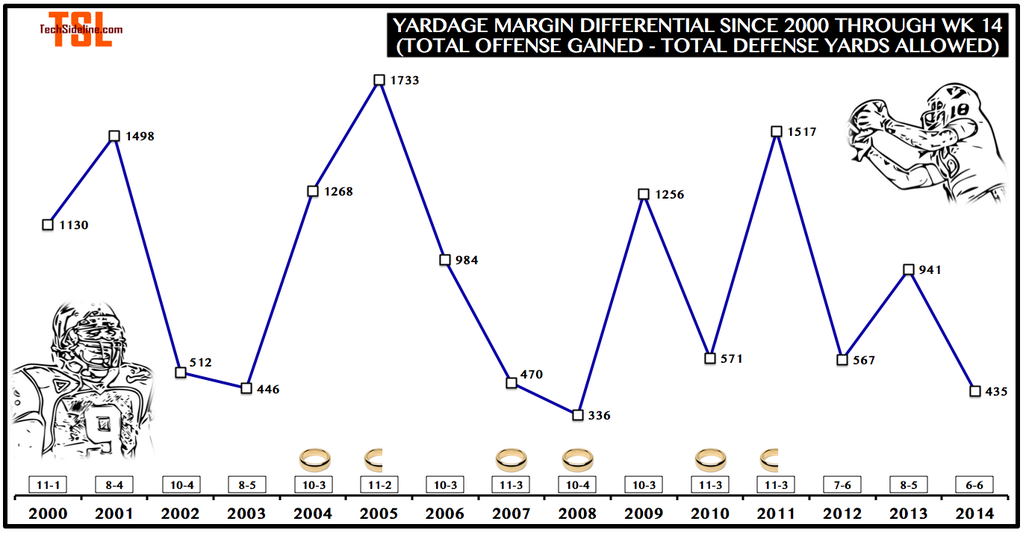
But you notice that the margin is comparable to some very good years, in terms of wins: 2002, 2007, 2008, and 2010.
What’s one of the differences between 2014 and those years? Turnover margin.

That negative turnover margin will get you every time.
Missing Tyrod – and LT3, 2011 version
As if you needed more evidence that the Hokies are a defense-oriented program, here it is.
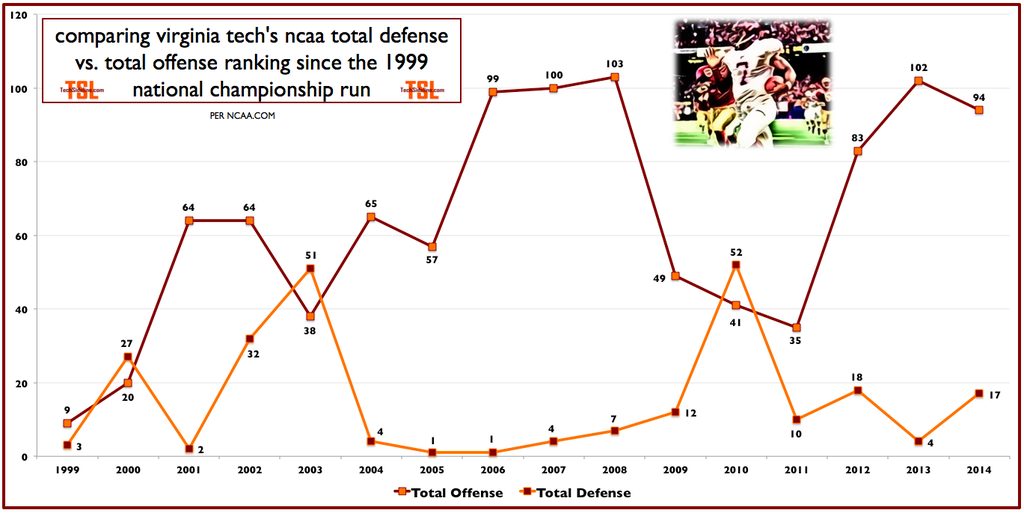
2009 and 2010 represent Tyrod Taylor’s junior and senior seasons, and 2011 is Logan Thomas’ first year, when he still had Jarrett Boykin, Danny Coale, and David Wilson to work with. The other six seasons between 2006 and 2014 represent a huge gap between the offense and defense, at least as measured in terms of total yardage rankings. (Football is more complicated than that, but those are the stats the NCAA keeps.)
We hope you have enjoyed this week’s infographic series. As always, you can see everyone one of our infographics updates on TSL by clicking here.
Many thanks to OXVT for the great infographics all season long! Follow him on Twitter, where he recently went over the (angels singing) 1,000-follower threshold.


Tech Sideline is Presented By: