
Note: The infographics are by OXVT, and the text is by Chris Coleman.
It’s been far too long since we featured some of OXVT’s wonderful infographics. Today we’ll take a look at preseason predictions and how the Hokies have (or haven’t) met those expectations through the years.
Summer officially began a few days back, which means newsstands are being flooded with preseason College Football magazines. If you’re like me, you used to buy those magazines religiously to see where the Hokies were picked each year. It was a big deal, and we all just knew that Tech would finish higher than any of the magazines predicted.
Indeed, that was the case throughout the 1990s, as this graphic by OXVT shows. Click for a larger image.
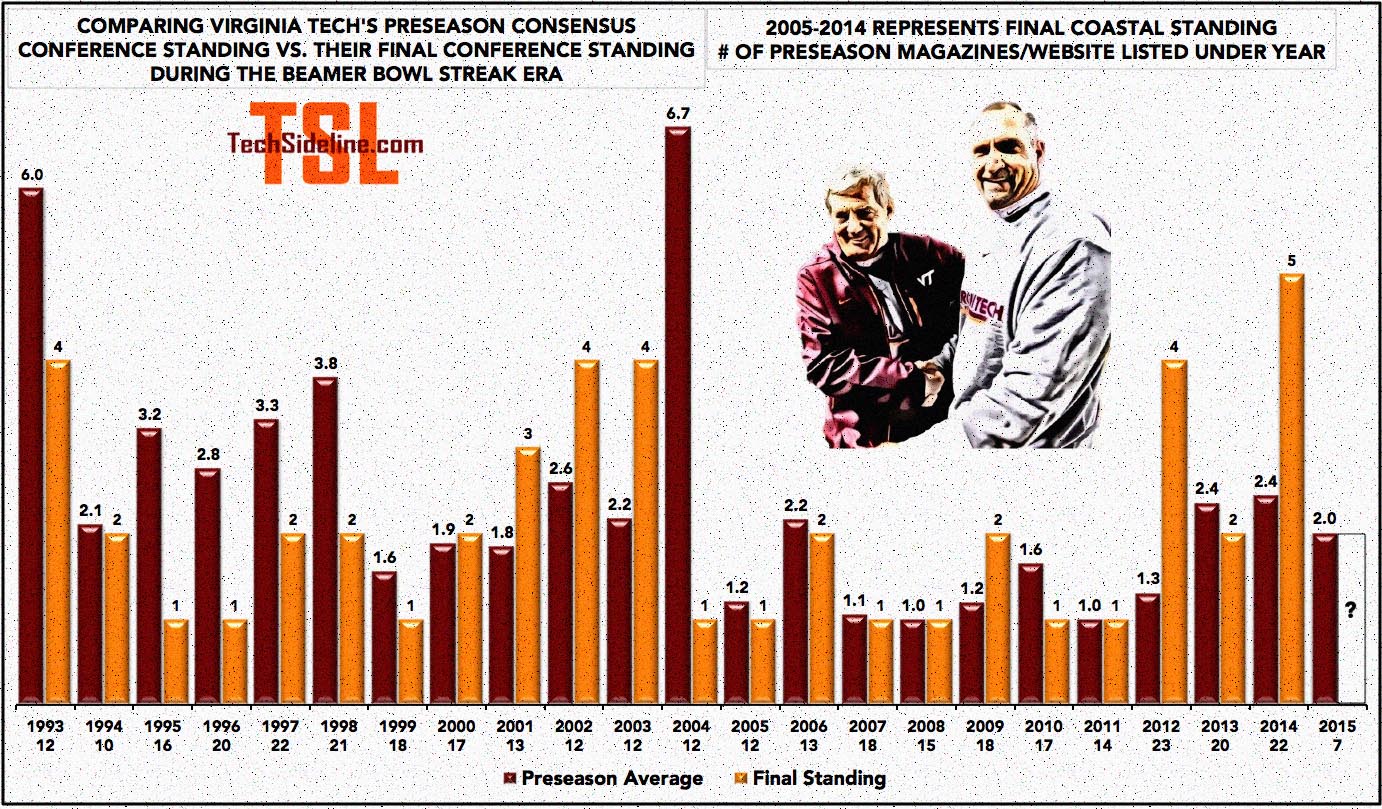
For the first few years of the Beamer Bowl Era, it was understandable. However, in the latter years of the 90s, the prognosticators got into the habit of overrating Miami and underrating Virginia Tech. In fact, the Hokies finished higher than they were projected every single season from 1993 through 1999.
Average conference prediction: 3.26. Remember, there were eight Big East teams.
Average conference finish: 1.86. Tech only had one finish below second place in that era.
It was in that era when the Hokies developed the reputation of being a team with a chip on their shoulders. Unfortunately, their success in that era led to expectations increasing over the next few years, and they couldn’t match those expectations. From 2000 through 2003, the Tech finished lower than predicted every single year.
Average conference prediction: 2.125
Average conference finish: 3.25
Tech’s best finish in those four seasons was their second place finish in 2000. They finished third in 2001, and fourth in both 2002 and 2003.
Those mediocre finishes made the 2004 run even more surprising. The Hokies were thought to be a middle of the pack team, and their average preseason prediction was 6.7. Everyone assumed that going from the Big East to the ACC was going to be difficult. Instead, Tech won the ACC and represented the league in the Sugar Bowl.
That set off a run of seven consecutive seasons in which the Hokies lived up to expectations in the Coastal Division. From 2005 through 2011, Tech finished at or around where they were expected to finish.
Average Coastal prediction: 1.33. Tech was obviously considered the best program in the Coastal.
Average Coastal finish: 1.29. Tech won the Coastal five times in seven seasons.
Though the Coastal Division wasn’t the strongest division in college football throughout those seasons, Virginia Tech did an outstanding job of living up to expectations.
The last three seasons have been up and down…mostly down, in fact. Tech’s average prediction in 2012 was 1.3, and they finished fourth. In 2013, they were picked 2.4 and finished second. In 2014, the average prediction was 2.4, and they finished a surprising fifth. The three-year average looks like this…
Average Coastal prediction: 2.03
Average Coastal finish: 3.67
The Hokies have not lived up to expectations over the last three years, though it’s easy to argue that those expectations were based on past results rather than the actual talent level on the roster.
So far seven publications have been released in 2015, and the average prediction for Virginia Tech this summer is second in the Coastal Division. Can they exceed expectations, or will they continue the recent trend of finishing lower than predicted? The schedule is favorable, particularly with Georgia Tech playing both Clemson and Florida State. If the Hokies can stay healthy, they should be able to factor into the Coastal Division race.
And now, for some bonus infographics. You can click each of them for a larger image.
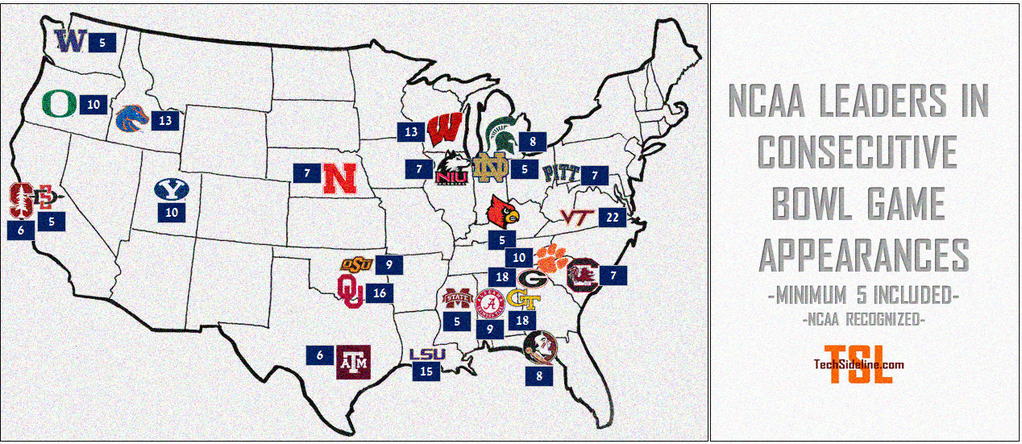
Virginia Tech has been to 22 consecutive bowl games. That’s the longest NCAA recognized streak in the country.
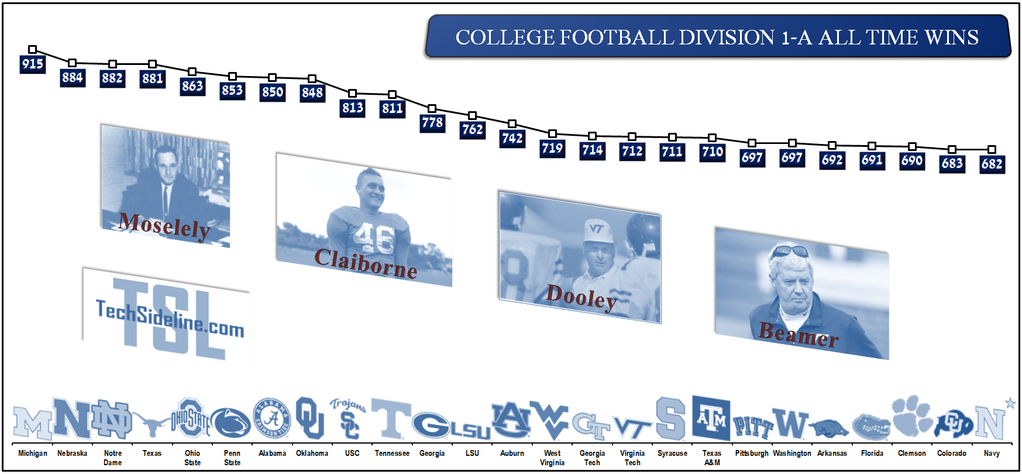
The Hokies also rank #16 in all-time wins in the history of college football. Of Tech’s 712 wins, Frank Beamer has 231 of them. That’s 32.4%.
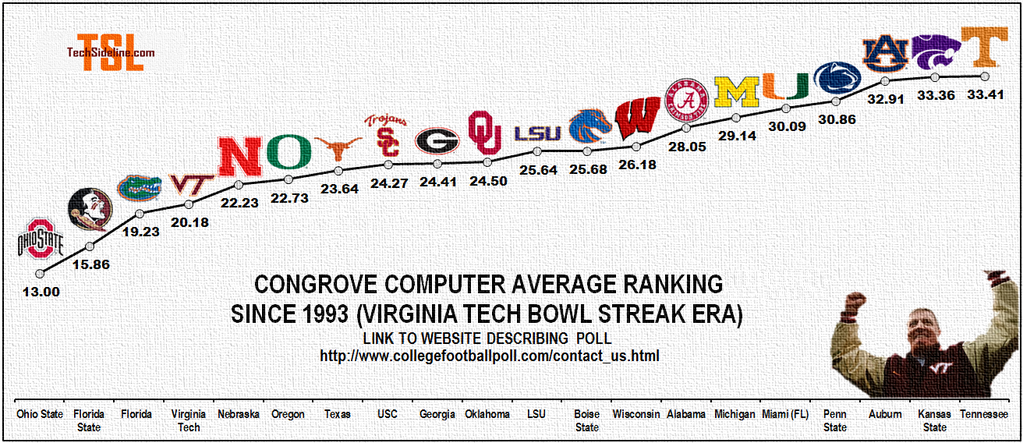
Believe it or not, the Hokies also rank #4 in the computer rankings since 1993. They trail only Ohio State, Florida State and Florida.
 Print
Print


All appear to be elite numbers\graphs, etc.
Parents of elite players over and over again prefer our staff.
How do we turn all this into elite recruits choosing VT? Because without them, we appear to have a very difficult road ahead of us.
Of course, many might answer that we have done well without them. I don’t buy that. Look at the draft picks and graph that one. Maybe it has been done already.
That’s harder to figure out then Analytical Calculus
Also harder to figure out than the difference between “then” and “than.” 🙂