
 Text by Will Stewart, infographics by OXVT (follow him on Twitter here, and view all previous infographics updates on TSL here). Click all infographics for a larger version!
Which ACC team has the most wins and the highest winning percentage against ranked teams since the 2004 expansion? The answer might surprise you.
Florida State? Clemson? Miami?
Nope. Virginia Tech.
OXVT ran the numbers recently, and they showed that the Hokies lead all other ACC teams in victories over top 25 teams (at the time of the game) in the last 11 seasons (2004-2014).

Here’s how the games against top 25 teams break down for Virginia Tech, using the past schedules found on hokiesports.com (which include rankings data):
| Season | Top 25 Wins | Top 25 Losses |
|---|---|---|
| 2004 (3-2) | VT 19, #6 WVU 13 #11 VT 24, #16 UVa 10 #10 VT 16, #9 Miami 10 | #1 USC 24, VT 13 #3 Auburn 16, #9 VT 13 |
| 2005 (3-1) | #4 VT 51, #15 GT 7 #3 VT 30, #13 BC 10 #12 VT 35, #15 Louisville 24 | #5 Miami 27, #3 VT 7 |
| 2006 (2-1) | VT 24, #10 Clemson 7 #19 VT 27, #14 Wake Forest 6 | #24 GT 38, #11 VT 27 |
| 2007 (3-3) | #15 VT 41, #22 Clemson 23 #8 VT 33, #16 UVa 21 #6 VT 30, #12 BC 16 | #2 LSU 48, #9 VT 7 #2 BC 14, #8 VT 10 #8 Kansas 24, #5 VT 21 |
| 2008 (3-1) | VT 23, #23 Maryland 13 VT 30, #18 BC 12 #21 VT 20, #12 Cincinnati 7 | #24 FSU 30, VT 20 |
| 2009 (2-2) | #13 VT 16, #19 Nebraska 15 #11 VT 31, #9 Miami 7 | #5 Alabama 34, #7 VT 24 #19 GT 28, #4 VT 23 |
| 2010 (3-2) | VT 41, #23 NC State 30 #14 VT 31, #24 Miami 17 #12 VT 44, #20 FSU 33 | #3 Boise State 33, #10 VT 30 #5 Stanford 40, #12 VT 12 |
| 2011 (2-3) | #10 VT 37, #20 GT 26 #6 VT 38, #24 UVa 0 | #13 Clemson 23, #11 VT 3 #21 Clemson 38, #5 VT 10 #13 Michigan 23, #17 VT 20 |
| 2012 (0-2) | None | #14 Clemson 38, VT 17 #8 FSU 28, VT 22 |
| 2013 (1-2) | VT 42, #14 Miami 24 | #1 Alabama 35, VT 10 #17 UCLA 42, VT 12 |
| 2014 (2-0) | VT 35, #8 Ohio State 21 VT 17, #19 Duke 16 | None |
| Overall | 24 Wins | 19 Losses |
24 wins over ranked teams is a lot of wins, but 19 losses is a lot of losses, as well. How does VT’s winning percentage match up with other ACC teams like FSU and Clemson?
Again … #1
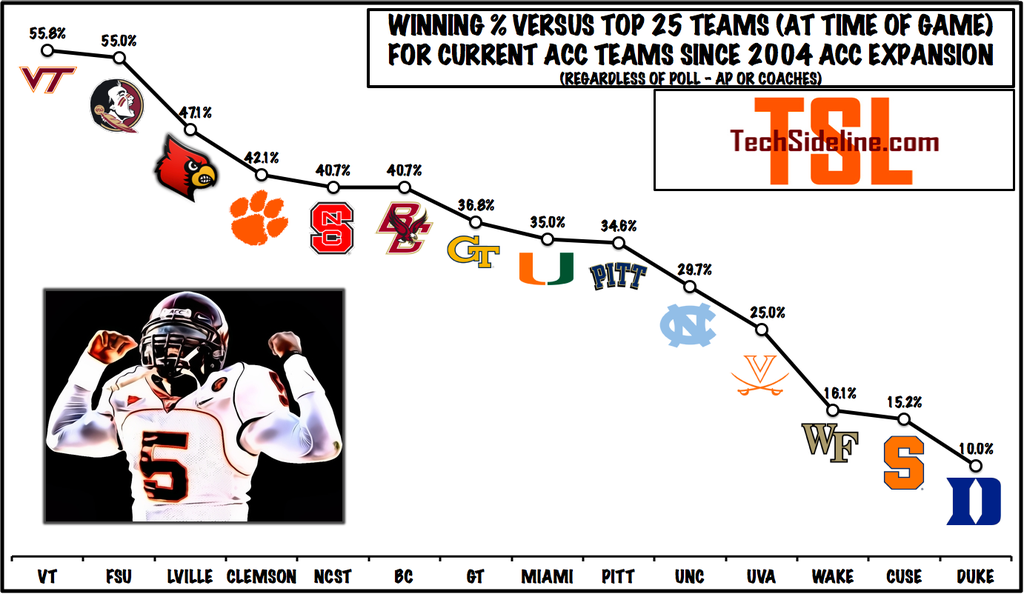
Both graphics so far really put things in perspective as to what Virginia Tech has achieved since entering the ACC.
But a couple questions arise:
1.) How do those wins break down in terms of where the opponents were ranked in the top 25?
In other words, is Virginia Tech achieving their success against (generally) lower-ranked teams than, say, FSU, Clemson, or Miami?
The answer is “sort of.” Here’s another graphic that breaks down the wins over top 25 programs in more detail.
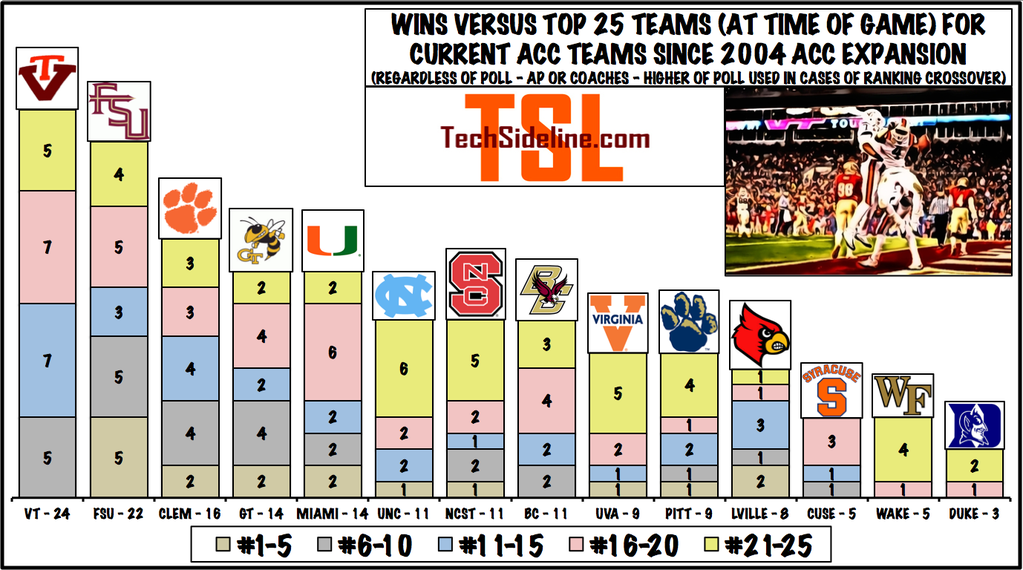
Parsing the information like that makes it more interesting. I notice two things:
- Three teams have more top 10 wins than the Hokies’ five: FSU (10), Clemson (6), and Georgia Tech (6).
- VT has no top 5 wins, but nine other ACC teams have combined for 17 wins over top 5 teams.
Of course, not shown in the data is the fact that Virginia Tech has the granddaddy of all wins. Tech’s 2014 victory over eventual national champion Ohio State shows up as a top 10 win (the Buckeyes were #8), but that win got a lot better with time. Without digging into old schedules too deep, only FSU’s win over #2 Auburn for the 2013 BCS Championship comes to mind as equally impressive.
2.) What have you done for me lately?
There’s no infographic for this one, but the answer for Virginia Tech is “not much.” Or more precisely “not as much as before.”
The Hokies are only 5-7 against top 25 teams in the last four seasons, though to be fair, Tech was 2-0 in 2014 alone (on the way to going 7-6 … go figure).
Do the math, and you’ll find that from 2004-2010, the Hokies were 19-12 against top 25 teams, an impressive winning percentage of 61.3%, which has since fallen to 55.8% from 2004-2014.
But in those same four years, per ESPN’s FSU schedule pages, Florida State’s Seminoles are 11-4. Slice it down to the last two seasons, and the ‘Noles are 9-1, with three wins over top 5 teams. FSU’s College Football Playoff loss to #2 Oregon broke a string of ten straight wins over ranked teams.
In the last four seasons, again per ESPN, Clemson is just 7-9 against ranked teams. Their winning percentage against the top 25 isn’t much better than VT’s in that time period, but the Tigers have more T25 wins, including two over Virginia Tech in 2011. Clemson lost all three of their games against ranked teams in 2014.
The Hokies have fared well against ranked teams since the ACC expanded in 2004, but to stay atop the heap in these measurements, they’ll have to get better. They’ll face a stiff test against reigning champion Ohio State next Labor Day night.
Many thanks to OXVT for the great infographics! Follow him on Twitter, where he produces all kinds of interesting stuff, constantly.
 Print
Print


Some corrections:
NC State has 12 wins over AP ranked teams, North Carolina only 10. Virginia has 9, Syracuse 6, Georgia Tech 16.
Louisville’s winning percentage over AP ranked team is 44.4%, Clemson’s is 40.0%, NC State’s is 45.2%, Boston College’s is 39.3%, GT’S is 38.1%, Pitt’s is 36.0, UNC’s is 25.0%, Virginia’s is 28.1%, Wake’s is 16.7%, Syracuse’s is 16.7%, Duke’s is 10.3%.
Georgia Tech as 5 wins over AP ranked top 10 teams.
If you look at and of year ranking, the orders don’t change much, though team’s percentages tend to go down:
1. Florida St. (18-23-0)–0.43902
2. Virginia Tech (15-23-0)–0.39474
3. Georgia Tech (15-25-0)–0.37500
4. Clemson (12-27-0)–0.30769
5. Pittsburgh (7-18-0)–0.28000
6. Louisville (6-16-0)–0.27273
7. Boston College (9-28-0)–0.24324
8. N.C. State (8-25-0)–0.24242
9. Miami (FL) (9-29-0)–0.23684
10. North Carolina (7-28-0)–0.20000
11. Wake Forest (6-32-0)–0.15789
12. Syracuse (4-28-0)–0.12500
12. Virginia (4-28-0)–0.12500
14. Duke (1-30-0)–0.03226
If we looked at year-end rankings what that have much of an impact?
Just an FYI: Line graphs are used to show trends (i.e., VT wins by season over time). If you’re comparing multiple teams for a single period (wins for each program since 2004), its much better to use a bar chart, as you did for two of the three graphs.
Why might we be surprised? From 2004-2011, we dominated our league more than any team in a BCS conference during that same time period. It was never close. And still, with the downtrodden last few years, we’re still holding firm leads in pretty much every overall metric other than MNC’s.
Man, I know we’ve been down and fans are inherently “what have you done for me lately”, but it’s interesting and bit confusing to me as to how quickly we forget how consistently good we were…for a very long time.
Great article and summary. Question- VT beat WVU in Morgantown in 2005. WVU beat GA in the Sugar Bowl later in the year, and I thought that the only loss was to VT. This was the game where MV was vocally treated badly by the fans, and he gave them the middle finger in frustration. So, was WVU not ranked at that time? I thought they finished 12-1, with only loss to VT. Thanks!!
Correct – West VA was not yet ranked at the time VT beat them 34-17. West VA entered the Top 25 in Week 7 of that year.
by my count when VT is ranked in the top 10 they are 7-9.
When both teams are ranked in the top 10 they are 1-6.
This is how the perception that VT never wins “big games” was born. Mediocre to downright poor results when the spotlight was brightest.
Very interesting point, and by my count, it’s worse than that when both teams are ranked in the top 10 … it’s actually 1-7.
The one win was back in 2004, when #10 VT beat #9 Miami to win the ACC. Since then, it’s 0-7 when both teams are ranked in the top 10:
2004: #3 Auburn 16, #9 VT 13
2005: #5 Miami 27, #3 VT 7
2007: #2 LSU 48, #9 VT 7
2007: #2 BC 14, #8 VT 10
2007: #8 Kansas 24, #5 VT 21
2009: #5 Alabama 34, #7 VT 24
2010: #3 Boise State 33, #10 VT 30
Note that VT only averaged 16 points in the 7 losses, though their point totals improved in the last three … just not enough.
That’s why a lot of the fans have been so frustrated over the years with the offense. Blew so many opportunities to do big things!
FWIW Tech was the higher ranked team in 2 of those 8 top 10 matchups. Meaning, all other things being equal, they should have lost 6 of those 8 games. So, when expected by the rankings to lose, Tech is 1-5. When expected to win, Tech is 0-2.
I know, rankings don’t necessarily accurately reflect a team’s relative strength. But that’s a whole ‘nother infograph and I have no idea how Ox would tackle it.
Rankings don’t indicate who the better team is. VT could’ve been favored in some of those games regardless of rank…
And they might have been underdogs in some games where they were the higher ranked team. Nokie, I get the flaw in relying on rankings (which I addressed in the 2nd paragraph of my earlier post) but if we’re talking about an article in which all of the info in the infographics are based on rankings, you have to accept some parameters.
Man- do I hate to look at that record against top 10 teams. Coach Beamer will forever live with a footnote on his legacy caused by just not doing enough to have a good offense to have great teams in many of those years.
You could turn that around and argue that Coach Beamer has been one of the best ever at getting the most out of his teams on a consistent basis, but the best those teams could muster often fell short when matched against other top tier teams. The games on this list where I thought VT really “let one get away” were:
2005 vs. Miami – No running attack until it was too late and Marcus Vick played poorly
2007 vs. B.C. – Great performance by Matt Ryan, but VT should have put that one away earlier
2007 vs. KU – Let’s not go there
2010 vs. Boise – One more first down or a defensive stop and we’re probably 13-0
2011 vs. Clemson x 2 – Maybe they just had our number, but I still think VT had the better team
2011 vs. Michigan – Danny caught the ball! (and DW wasn’t down by contact, and Jayron was being interfered with as much as he interfered, etc.)
Looking back, though, it’s probably those games and those seasons that have created the impression that Beamer’s VT teams can’t win the big one and don’t quite measure up to the truly elite programs. On the other hand, it’s taken one heck of a run just to get VT in that conversation.
Thanks for taking another look at it by percentage as I suggested on the message board. It is surely more meaning.
Would also help to have a graph of the listing the ACC teams by the average ranking of the top 25 teams they beat. That would show very easily the impact of loading up on lower ranking top 25 teams as you discussed. You could even put them on the same graph. Have percent on the left index and average ranking on the right index.
Why don’t we ever win any big games??
Tic lol
Cool stuff. Thanks, OX. I’d be interested in on what stages each of these loses and wins occurred on. The numbers show VT had beaten more ranked teams than it has lost to, and yet the perception is VT doesn’t beat ranked teams. Did more of the losses occur either in bowls or late-season, widely watched games, and the wins occur early or in basic, conference games?
As a roundabout way of answering that question, or perhaps just adding something to it, take Clemson … the Tigers are only 7-9 against ranked teams in the last four seasons, but they have some high-profile non-conference wins that have “upped” their perception:
2012: Won 25-24 over #14 LSU in the CFA Bowl
2013: Beat #5 Georgia 38-35 in their season opener
2013: Beat #12 Ohio State 40-35 in the Orange Bowl
Those wins, which we all remember, make it seem as if the Tigers are doing better against T25 competition.
VT is 5-7 against T25 teams in the last four seasons. By contrast, VT’s wins consist largely of conference games against non-glamour teams: GT, UVA, Miami, and Duke. The win over Ohio State, of course, stands out.
In that same time period (2011-14), VT has lost to OOC teams Michigan (Sugar Bowl), Alabama (CFA Kickoff), and #17 UCLA (Sun Bowl). There have been no wins over ranked OOC teams in high profile (bowl or preseason) games … “just” the win over Ohio State, which, while very nice, didn’t really shift the perception of VT’s program, in my opinion, because it was part of a 6-6 regular season.
Maybe fans don’t feel we win big games because we only won 4 out of 24 wins to OOC teams and we lost 10 out of 19 losses to OOC teams. It appears we can beat top 25 ACC teams and struggle with OOC teams.
Interesting stats. Thanks OX.