
 The latest infographics, including a look at the Heinz Field House of Horrors, sacks and interceptions year by year, and more.
To see all of OXVT’s infographics, follow him on Twitter at @OX_VT. Follow TSL on Twitter at @TechSideline.
Great work by OXVT as always, and be sure to tweet your infographic requests to him on Twitter @OX_VT, or post them to our message boards.
You can see all of OX’s previous infographics by clicking here.
CLICK EACH OF THE FOLLOWING INFOGRAPHICS TO SEE A LARGER, FULL-SIZED VERSION.
How rough has it been for VT in their three tips to Heinz Field, which the Hokies have lost 38-7 (2001), 31-28 (2003), and 35-17 (2012)? Take a look:
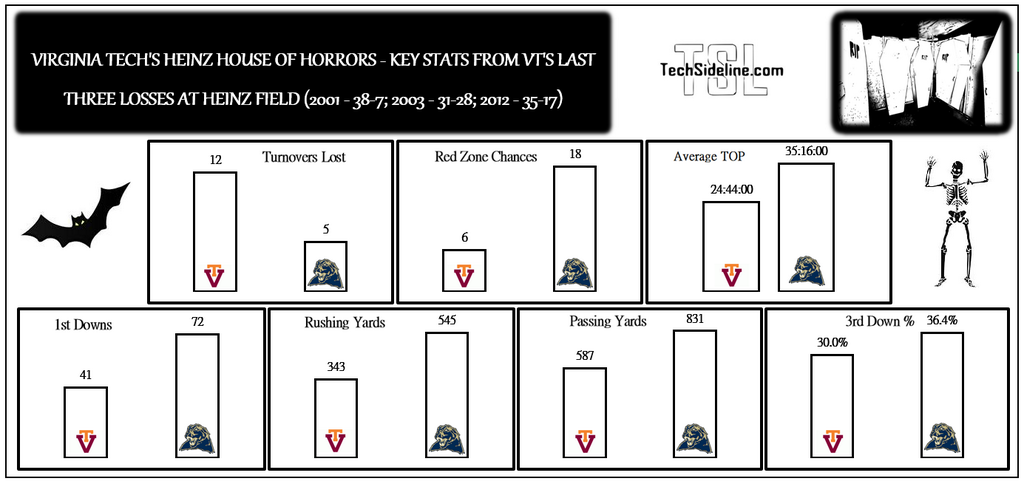
Yikes. Here’s hoping the Hokies reverse that trend in a big way tonight!
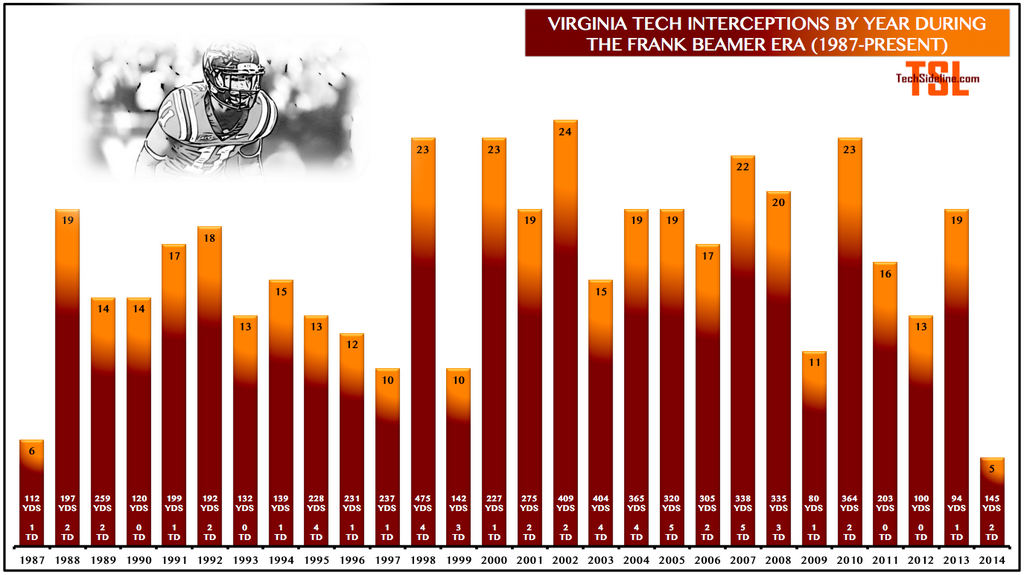
Interceptions are a little slow for the Hokies so far this season, though VT has been the best in the nation from 2000-2013. Here’s a look at how 2014 stacks up with other seasons.
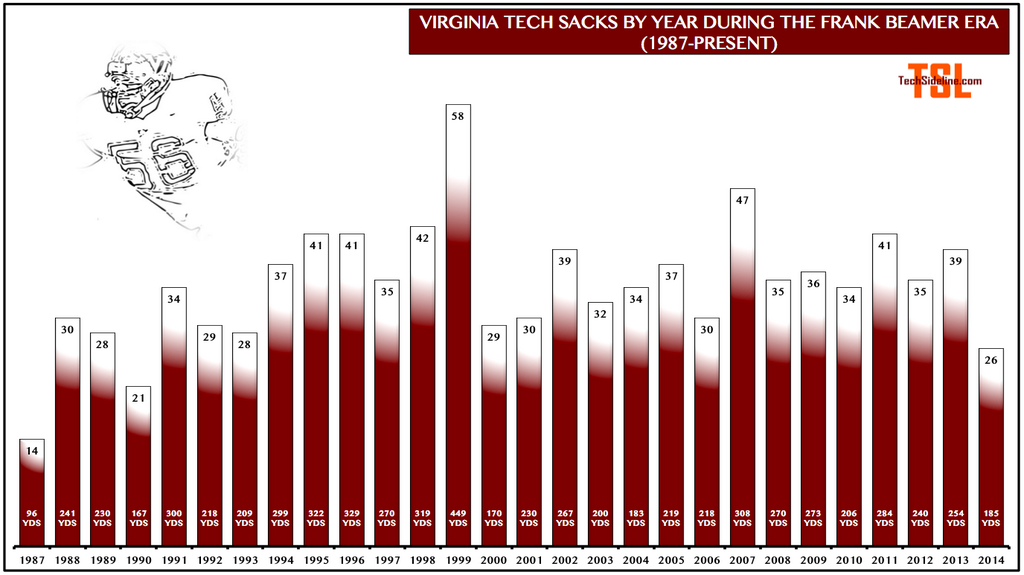
One stat that is NOT trending a little cold are sacks. The Hokies might set a season record for sacks under Frank Beamer, if things continue like they’ve been so far.
The Hokies are on course for 52 regular-season sacks, 56 if they play in a bowl game, and 60 or 61 if they play in the ACCG and a bowl game.
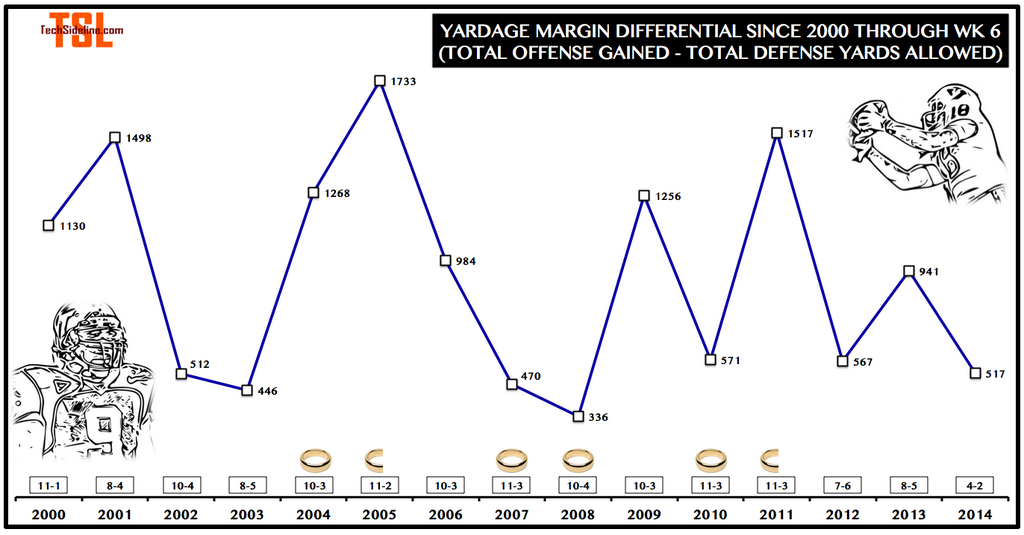
The Hokies have outgained their opponents by 517 yards this season. How does that compare to other seasons of recent vintage? Not bad. Tech’s 2014 Week 6 yardage margin is already better than some entire recent seasons, including two ACC championship seasons (2007 and 2008).
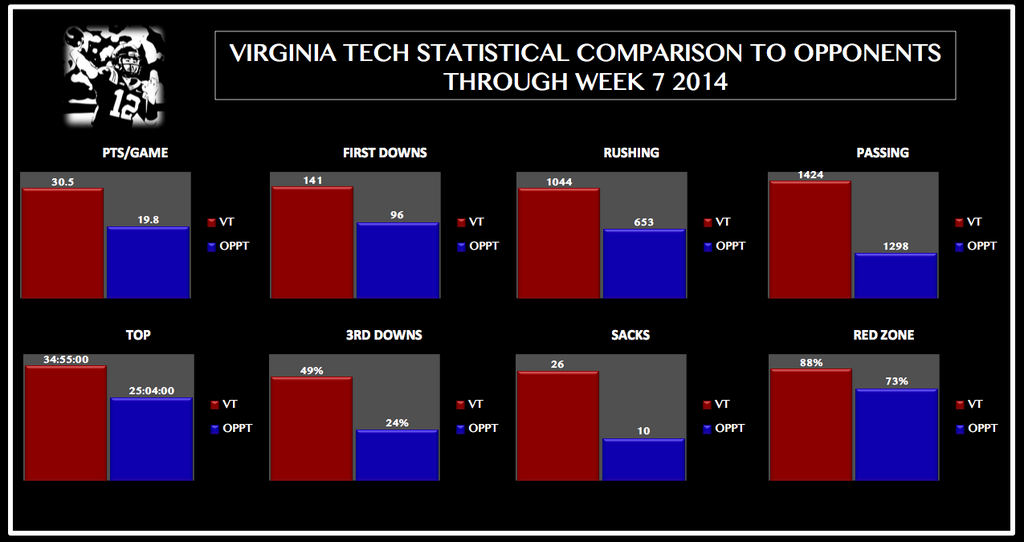
In many statistical areas, the Hokies are way ahead of their opponents so far this season.
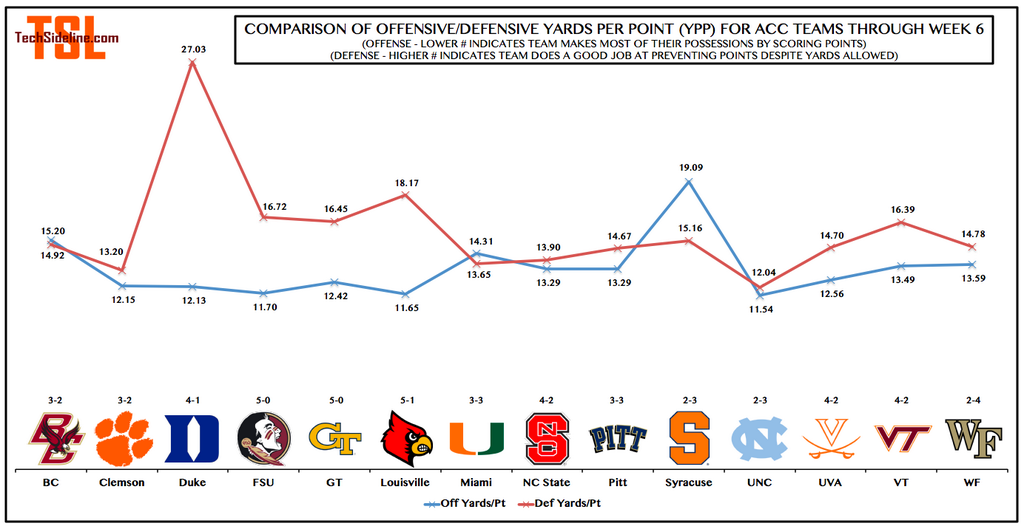
Here’s an interesting chart: a comparison of offensive and defensive yards per point so far for all ACC teams.
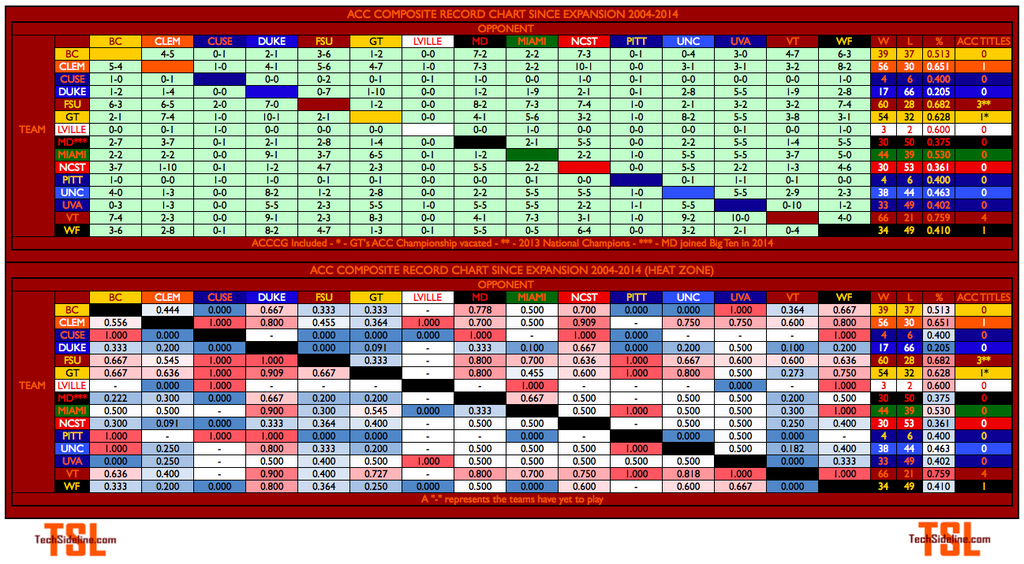
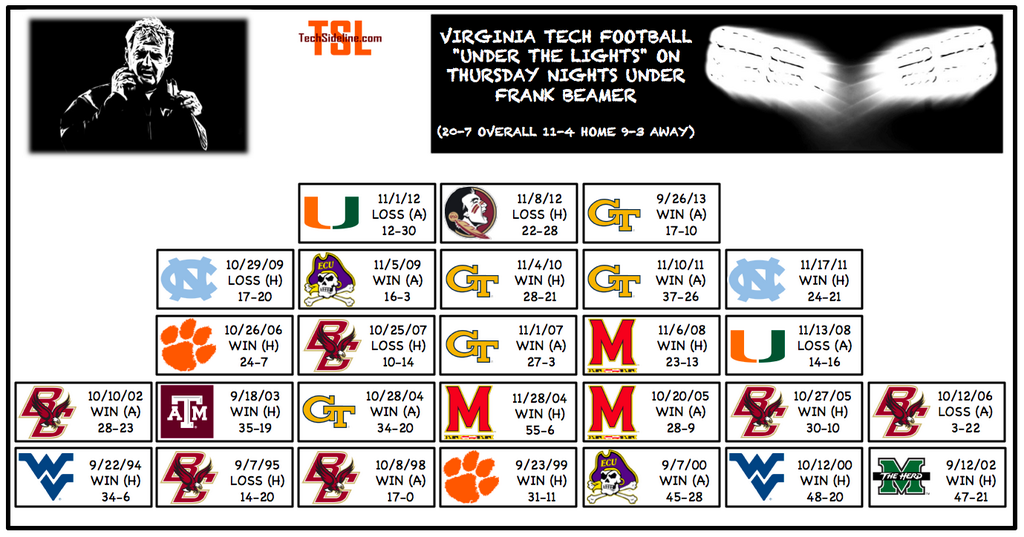
Lastly: ACC composite records (with “heat chart”) since expansion through last weekend, a look at the remaining Power 5 unbeatens, and a chart of VT’s Thursday night ESPN appearances.

Play with the bull (OXVT), and you’ll get the horns … and lots of great infographics. Thanks, OXVT!
 Print
Print


Someone is red hot in the bottom-right corner of that ACC composite record heat chart!! Go Hokies!
Appreciate the suggestion 🙂
Does the sack total of 58 from 1999 season include the bowl game? I know the NCAA changed the way they kept stats in the 2000’s to include bowl games. It just shows how nasty that defense was considering they accumulated that many sacks in 11 or 12 games.
Correct – Prior to 2002, Bowl game stats were not apart of official NCAA statistics. I only included the official ones. ’99 technically had 62 sacks (4 vs. FSU) – My next update to that chart may account for bowl games prior to 2002.