
In case you don’t follow us on Twitter (shame on you), then you have missed some fun infographics, courtesy long-time TSL member OXVT.
Wikipedia has an entry for infographics that says:
Information graphics or infographics are graphic visual representations of information, data or knowledge intended to present complex information quickly and clearly. They can improve cognition by utilizing graphics to enhance the human visual system’s ability to see patterns and trends. The process of creating infographics can be referred to as data visualization, information design, or information architecture.
Well, that’s just a fancy way of saying “Infographics are fun pictures with data in them.”
Recently, we have become intrigued by the infographic work being done on Twitter by long-time TSL member OXVT (Joined: Nov. 19, 2001; 51,807 posts) and have started retweeting his stuff. It has garnered a lot of retweets, so we thought we would bring some of it to the site, for those of you who don’t “Twit,” as the non-Twitter people often say.
Look for a lot more of OXVT’s stuff appearing on TSL, and follow him on Twitter at @OX_VT (or just look for us retweeting his stuff; either way works).
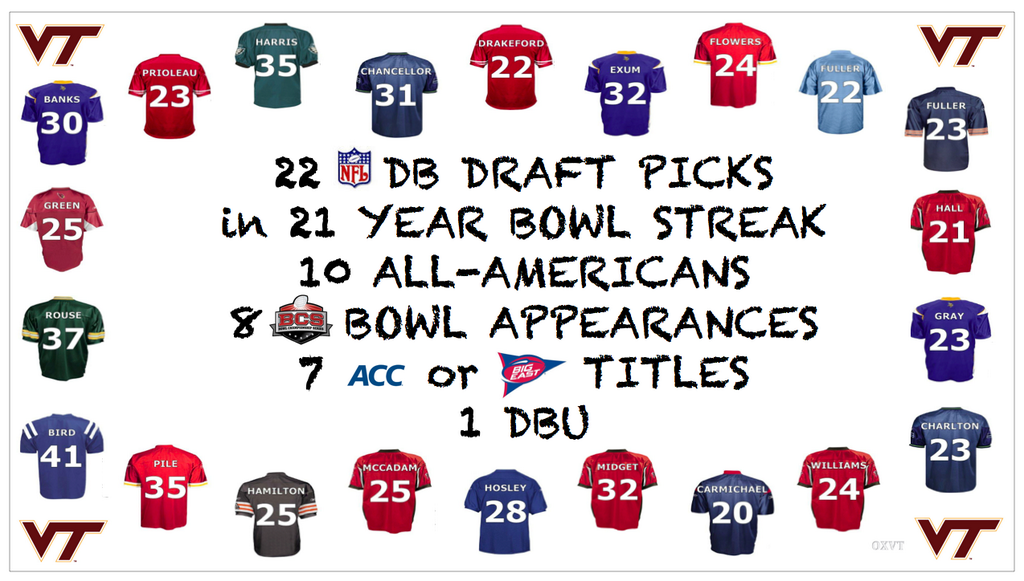
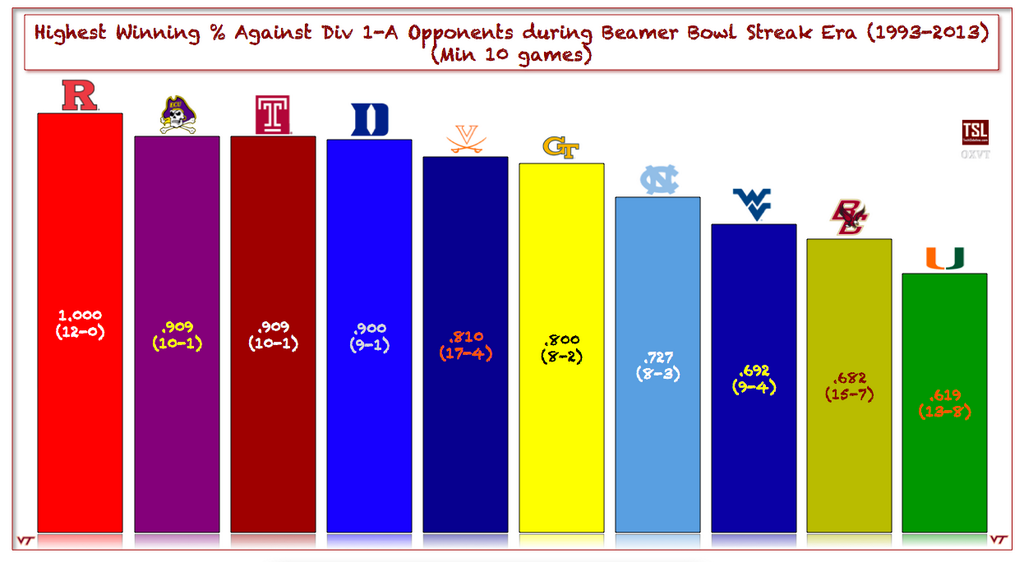
CLICK EACH OF THE FOLLOWING INFOGRAPHICS TO SEE A LARGER, FULL-SIZED VERSION.


Tech Sideline is Presented By: