
The Hokies are 4-1, and they’re putting up impressive numbers on both sides of the ball. There’s no better way to illustrate some of those numbers than by running an OXVT infographic article.
The No. 17/19 Hokies play at Syracuse on Saturday. There’s a good chance that their offensive rankings will go up, while their defensive rankings are likely to drop slightly. Syracuse is ranked No. 43 in the country in offensive S&P+, but only No. 91 in the defensive S&P+ ratings. The S&P+ ratings give the Orange less than a 50 percent chance in every single one of their remaining games. In short, this is not a good football team the Hokies will be playing on Saturday afternoon, especially on defense.
Because he’ll be facing such a porous defense, quarterback Jerod Evans will have a chance to add to his already impressive resume.
Click all infographics for a larger image, if needed.
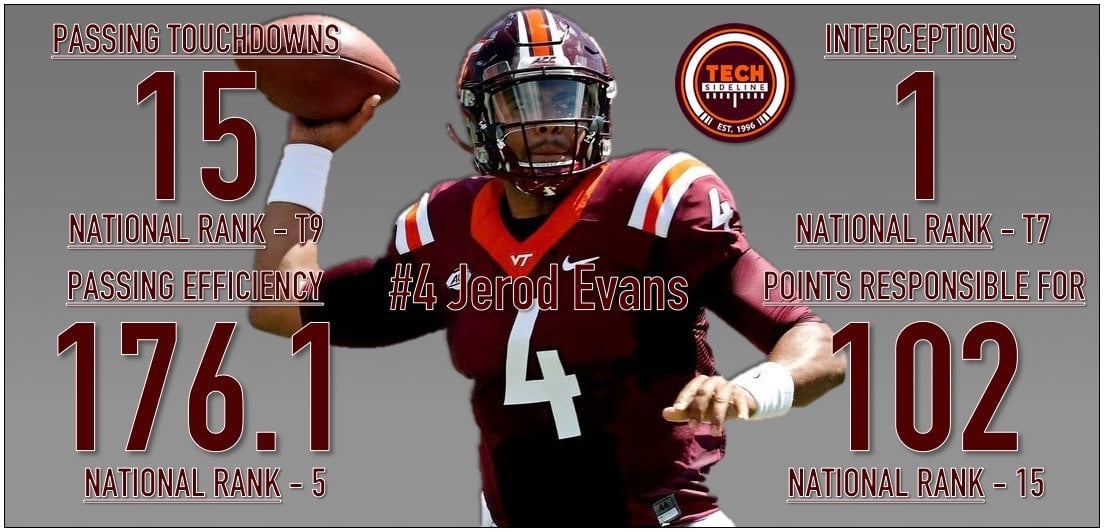
None of us knew exactly what to expect from Evans this year. I think it’s safe to say that he has exceeded expectations. It’s clear that Justin Fuente and Brad Cornselsen know how to put their quarterbacks in a position to succeed.
Those national rankings are impressive. So is his passing efficiency rating, which ranks first in the ACC by a fairly substantial margin.

The impressive play of Evans has helped the Hokies in all situations. However, it has especially helped them in the redzone.
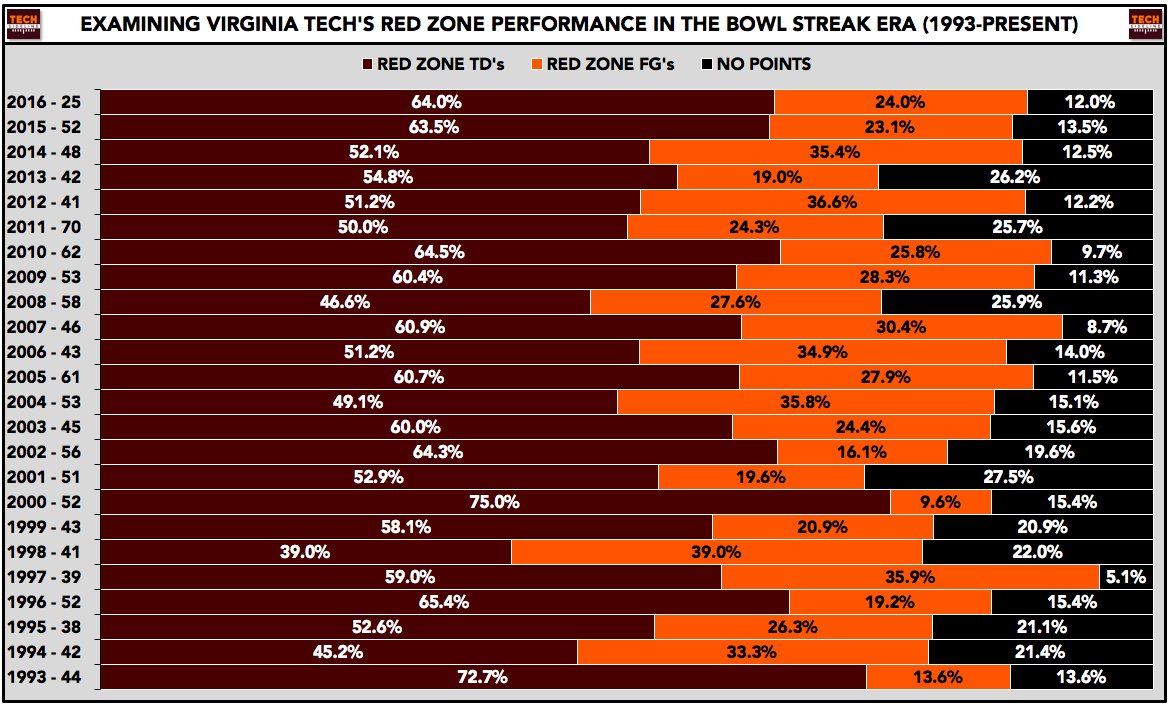
As you can see, Virginia Tech’s touchdown percentage in the redzone is higher than it’s been in any year since 2010 when Tyrod Taylor was a senior. Obviously Fuente and Cornselsen have a great feel for playcalling in the redzone, but having a running threat like Evans under center helps quite a bit.
Evans has helped the Hokies a lot in the running game and with the reemergence of Bud Foster’s defense, Virginia Tech’s advantage margin in the running game is the highest it’s been in a long time.
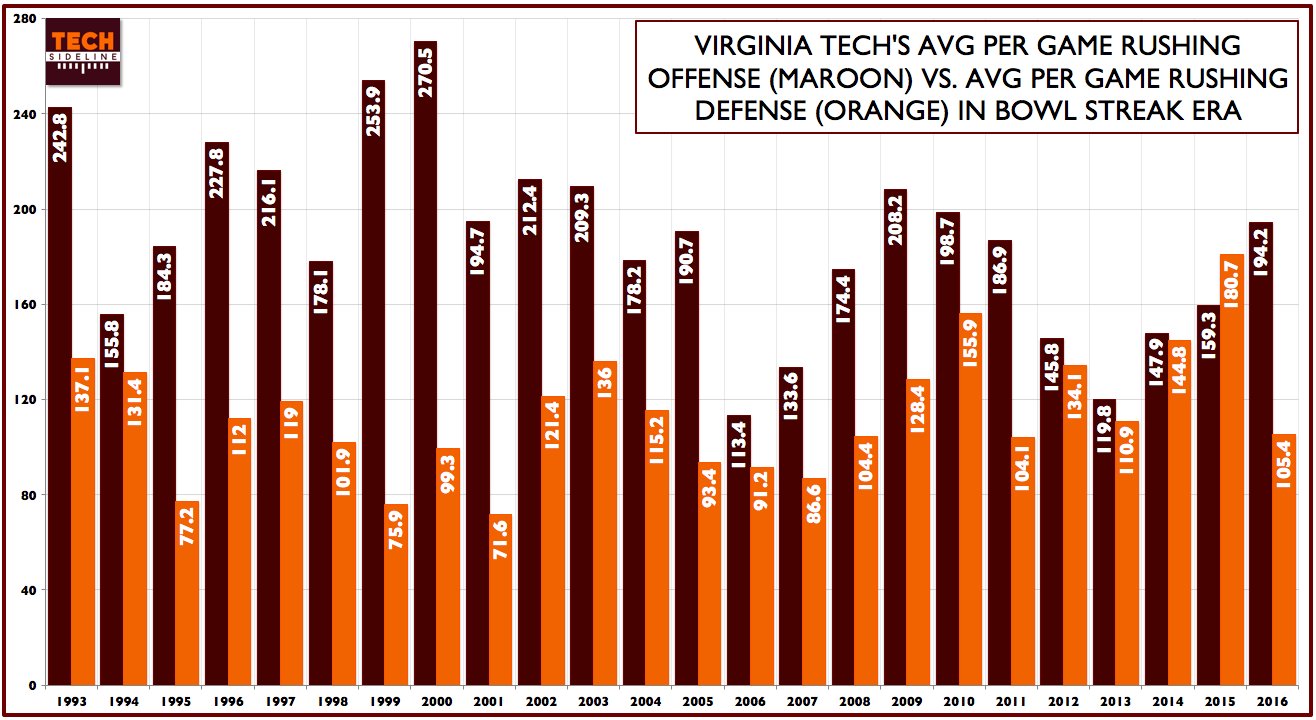
If Tech can keep dominating teams on the ground, they’re going to win a lot of football games.
Through the first five games of the season, the Hokies have dominated their opponents in terms of total yardage. Tech is third in the ACC in yardage differential.
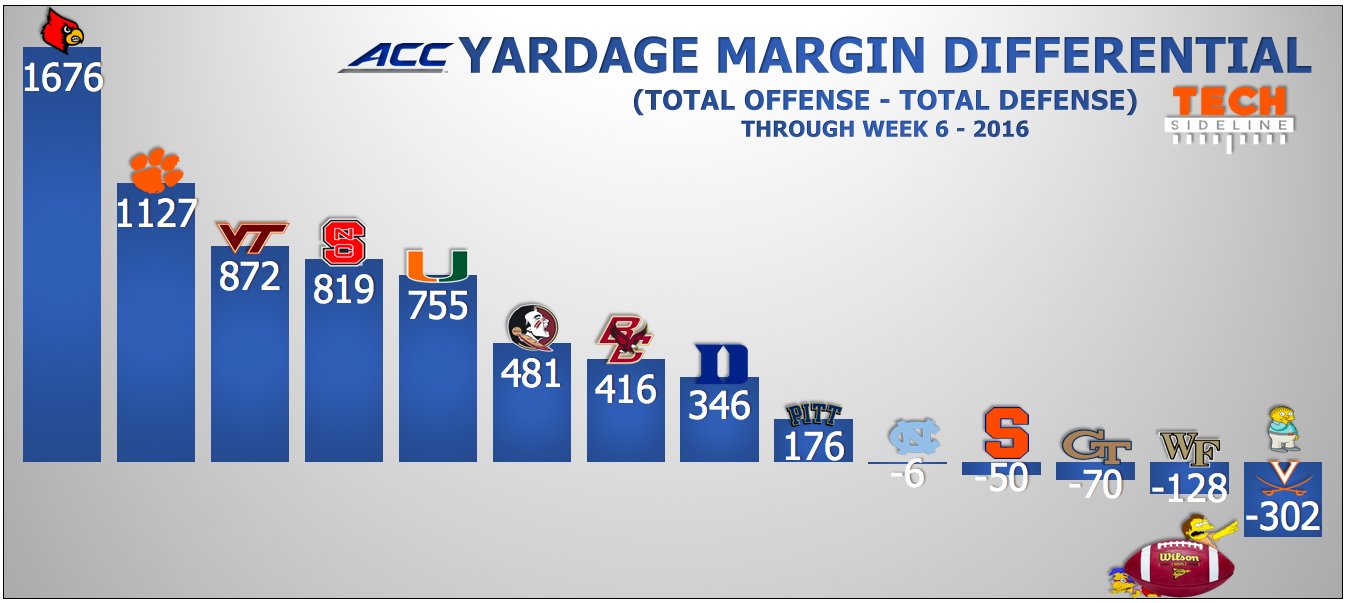
Keep in mind that Clemson has played six games to Virginia Tech’s five.
The Virginia Tech defense currently ranks third in the nation in total defense after holding North Carolina to just 131 yards on Saturday. They are behind only Michigan and Florida. A big reason for their improvement is the lack of big plays that they’ve allowed.
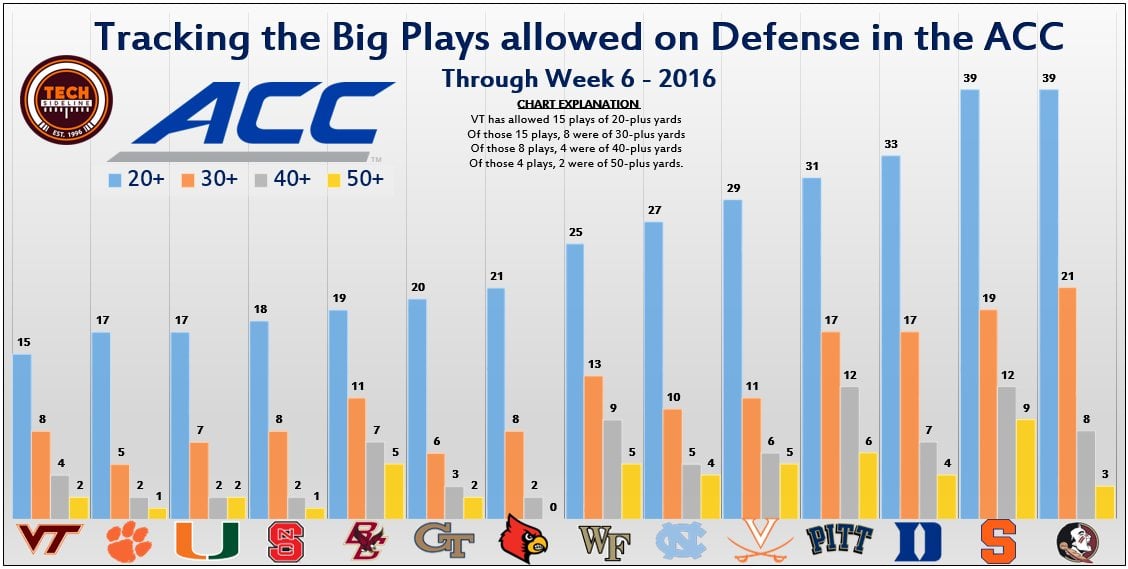
The Hokies are stuffing the run and clearly opposing teams are having trouble getting the ball down the field consistently against Tech’s much-improved secondary. That’s a recipe for defensive success.
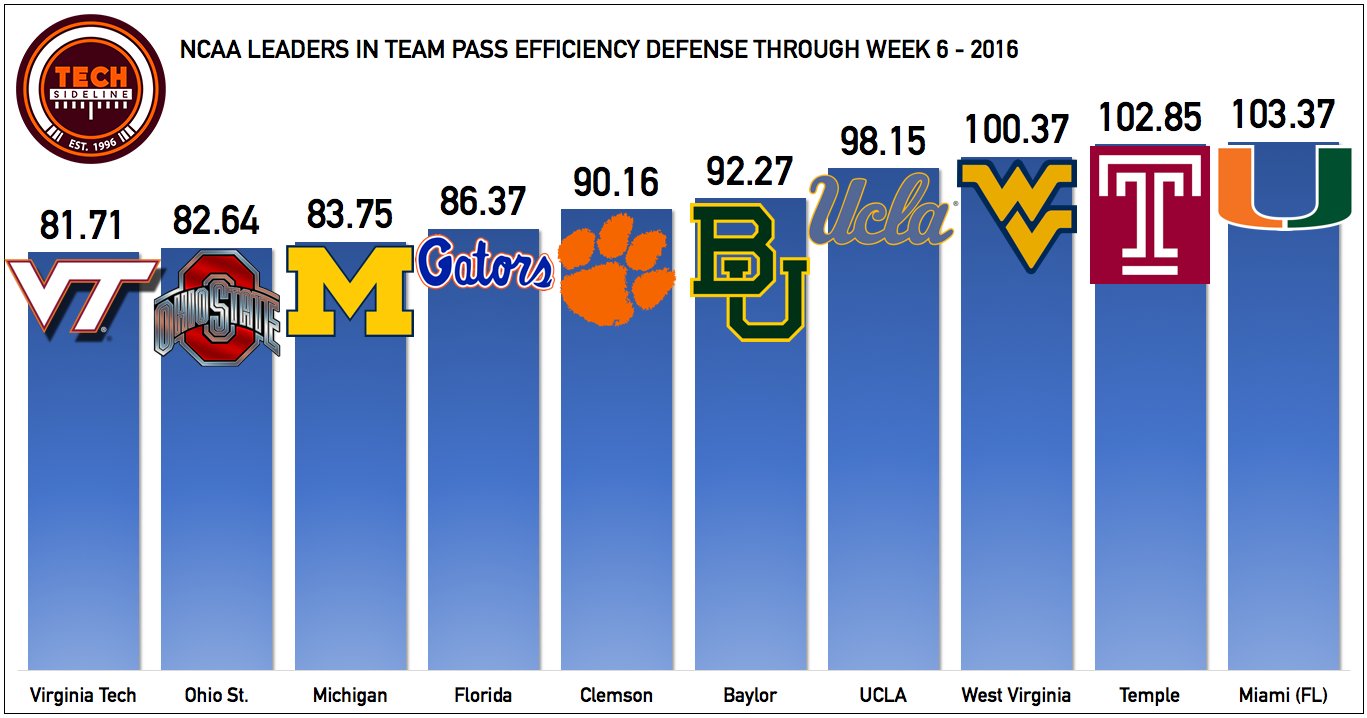
Wondering about the stats of opposing quarterbacks this year? Opposing quarterbacks are 58-of-142 (40.8 percent) for 661 yards for five touchdowns and seven interceptions. That’s pretty incredible, and it means the Hokies are No. 1 in the country in pass efficiency defense.
There’s no bigger down in football than third down, and the Hokies have been dominant on this down through the first five games of the season. Tech’s offensive third down rate is 44.4 percent, which is the fourth-best number since the 2000 season. Tech’s defensive third down rate is 19.2 percent, which is the best number since 2000.
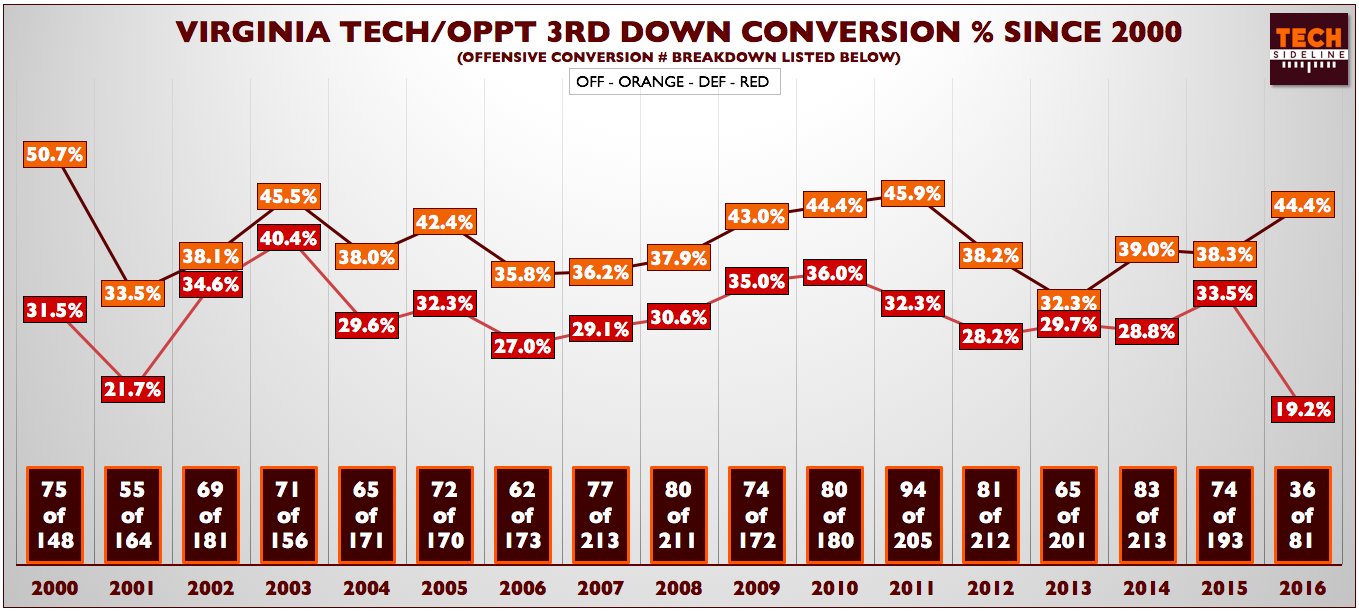
Given those third rates, it becomes a lot easier to see why the Hokies have defeated their last three opponents by a combined score of 137-20.
 Print
Print


Really good article I found myself coming back to it several times to absorb all of he information thanks
That offense/defense third down difference (last graphic) has me concerned. Either the that explains a lot and will show Coach Fuente’s advantage over Coach Beamer, or that is due to an N of 5 and regression to the mean for a season could create problems in upcoming games.
Oh it could be simply that it’s an indication of the fact we haven’t had the injuries this year versus the last two years. Last year’s 3rd eff. was very similar to every year before it with the exception of a few years, and yes, I’m defending Coach B.
Ralph Wiggum as UVA!!! LOVE IT!!!
WOW.
Do you have the Total Yards on Offense vs the total yards allowed by the defense and how that ranks nationally or over the years?
Yea …I would have made it higher….
Evans is clearly doing lots of good things, but our red zone numbers for 2016 are pretty much right where they were in 2015, so I’m not sure how you make a conclusion about Evans making a big difference there.
We’ve already gotten *to* the redzone almost half as many times as last year in only 5 games (and we’re over half of the 3 prior years)…that seems like the bigger change
The difference is we are in the red zone a LOT more this year I wish he had touched on that. A high percentage is meaningless if you’re rarely in the red zone, which seemed like the case to me last year.
True. If I’m reading the graph correctly, it looks like all of last year we had 52 trips in the red zone, while we already have 25 this year in just five games.
that scale on the y axis for ACC QB ratings is such a joke
yeah, that got some raised eyebrow from me too…really, he’s that much higher? oh, no, not really